consort
Reporting & VisualizationCONSORT-style exclusion flowcharts (requires Python 3.7+)
Version 1.1.1 | 2026-08-05
consort records sequential exclusions from a Stata dataset and renders the resulting participant-flow diagram. It is for analysts who need reproducible exclusion counts, publication-ready flowcharts, and optional machine-readable exports.
Quick Start
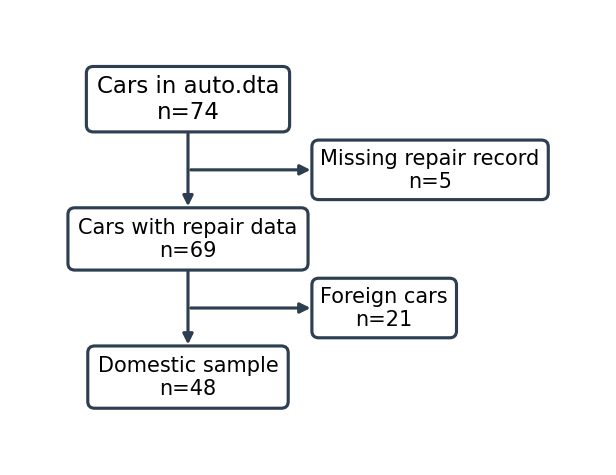
Build a shaded flowchart from Stata's built-in auto data:
sysuse auto, clear
preserve
consort init, initial("Cars in auto.dta")
consort exclude if missing(rep78), label("Missing repair record")
consort exclude if foreign, label("Foreign cars")
consort save, output("consort_auto.png") final("Domestic analytic sample") shading
restore
The workflow writes consort_auto.png in the current working directory and restores the original data after the diagram is saved. Python 3 with matplotlib must be available to Stata's shell; see Requirements if it is not installed.
Requirements
- Stata 16.0 or later
- Python 3.7 or later, available to the shell launched by Stata
- Python package
matplotlib
The bundled consort_diagram.py renderer uses only matplotlib. The xlsx() export is written by Stata and does not require an additional Python package such as openpyxl.
Install matplotlib into the same Python environment that Stata will call:
python -m pip install matplotlib
Use python3 -m pip install matplotlib when python3 is the executable available on your system, or specify the executable with python() in consort save.
Installation
Install the released package from Stata-Tools:
capture ado uninstall consort
net install consort, from("https://raw.githubusercontent.com/tpcopeland/Stata-Tools/main/consort") replace
The installation includes both consort.ado and the bundled consort_diagram.py renderer. Check the installation with:
which consort
help consort
Commands
| Command | Description |
|---|---|
consort |
Manage a stateful exclusion workflow and generate a CONSORT-style flowchart |
The command has four subcommands: init, exclude, save, and clear.
How It Works
consort initrecords the current observation count and creates a backing CSV with the initial population label.consort excludecounts observations matching anifcondition, records the exclusion, and drops those observations from the active dataset.consort saveupdates the final label, calls the bundled Python renderer, and optionally writes resolved CSV and Excel tables alongside the image.consort clearabandons the active workflow and removes temporary state without generating a figure.
Exclusions are applied sequentially, so each later condition acts on the observations that remain after earlier exclusions. A condition matching zero observations is reported and skipped: no observations are dropped, no backing-CSV row is added, and the exclusion-step counter is not incremented. A successful save clears the active workflow state.
Worked Examples
1. Basic workflow with a milestone label
Use remaining() to label an important intermediate population rather than displaying only its count.
sysuse auto, clear
preserve

consort init, initial("Cars in auto.dta")
consort exclude if missing(rep78), label("Missing repair record") remaining("Cars with repair data")
consort exclude if foreign, label("Foreign cars")
consort save, output("consort_milestones.png") final("Domestic analytic sample")

restore
2. High-resolution shaded output with an explicit Python executable
Pass the executable name or full path when Stata does not see the Python installation you want to use. dpi(300) is suitable for many print workflows.
sysuse auto, clear
preserve

consort init, initial("Cars in auto.dta")
consort exclude if missing(rep78), label("Missing repair record")
consort exclude if foreign, label("Foreign cars")
consort save, output("consort_300dpi.png") python("python3") shading dpi(300)

restore
3. Export resolved CSV and Excel data with the figure
Request either or both companion tables with csv() and xlsx(). Both exports contain one resolved row per diagram node.
sysuse auto, clear
preserve

consort init, initial("Cars in auto.dta")
consort exclude if missing(rep78), label("Missing repair record") remaining("Cars with repair data")
consort exclude if foreign, label("Foreign cars")
consort save, output("flow.png") final("Domestic sample") csv("flow.csv") xlsx("flow.xlsx")

restore
4. Keep and inspect the intermediate backing CSV
Use file() when you want the raw exclusion record available for inspection or controlled editing before save.
sysuse auto, clear
preserve

tempfile consort_backing
consort init, initial("Cars in auto.dta") file("`consort_backing'")
consort exclude if missing(rep78), label("Missing repair record")
consort exclude if foreign, label("Foreign cars")
consort save, output("consort_from_backing.png") final("Domestic sample")

restore
Demo
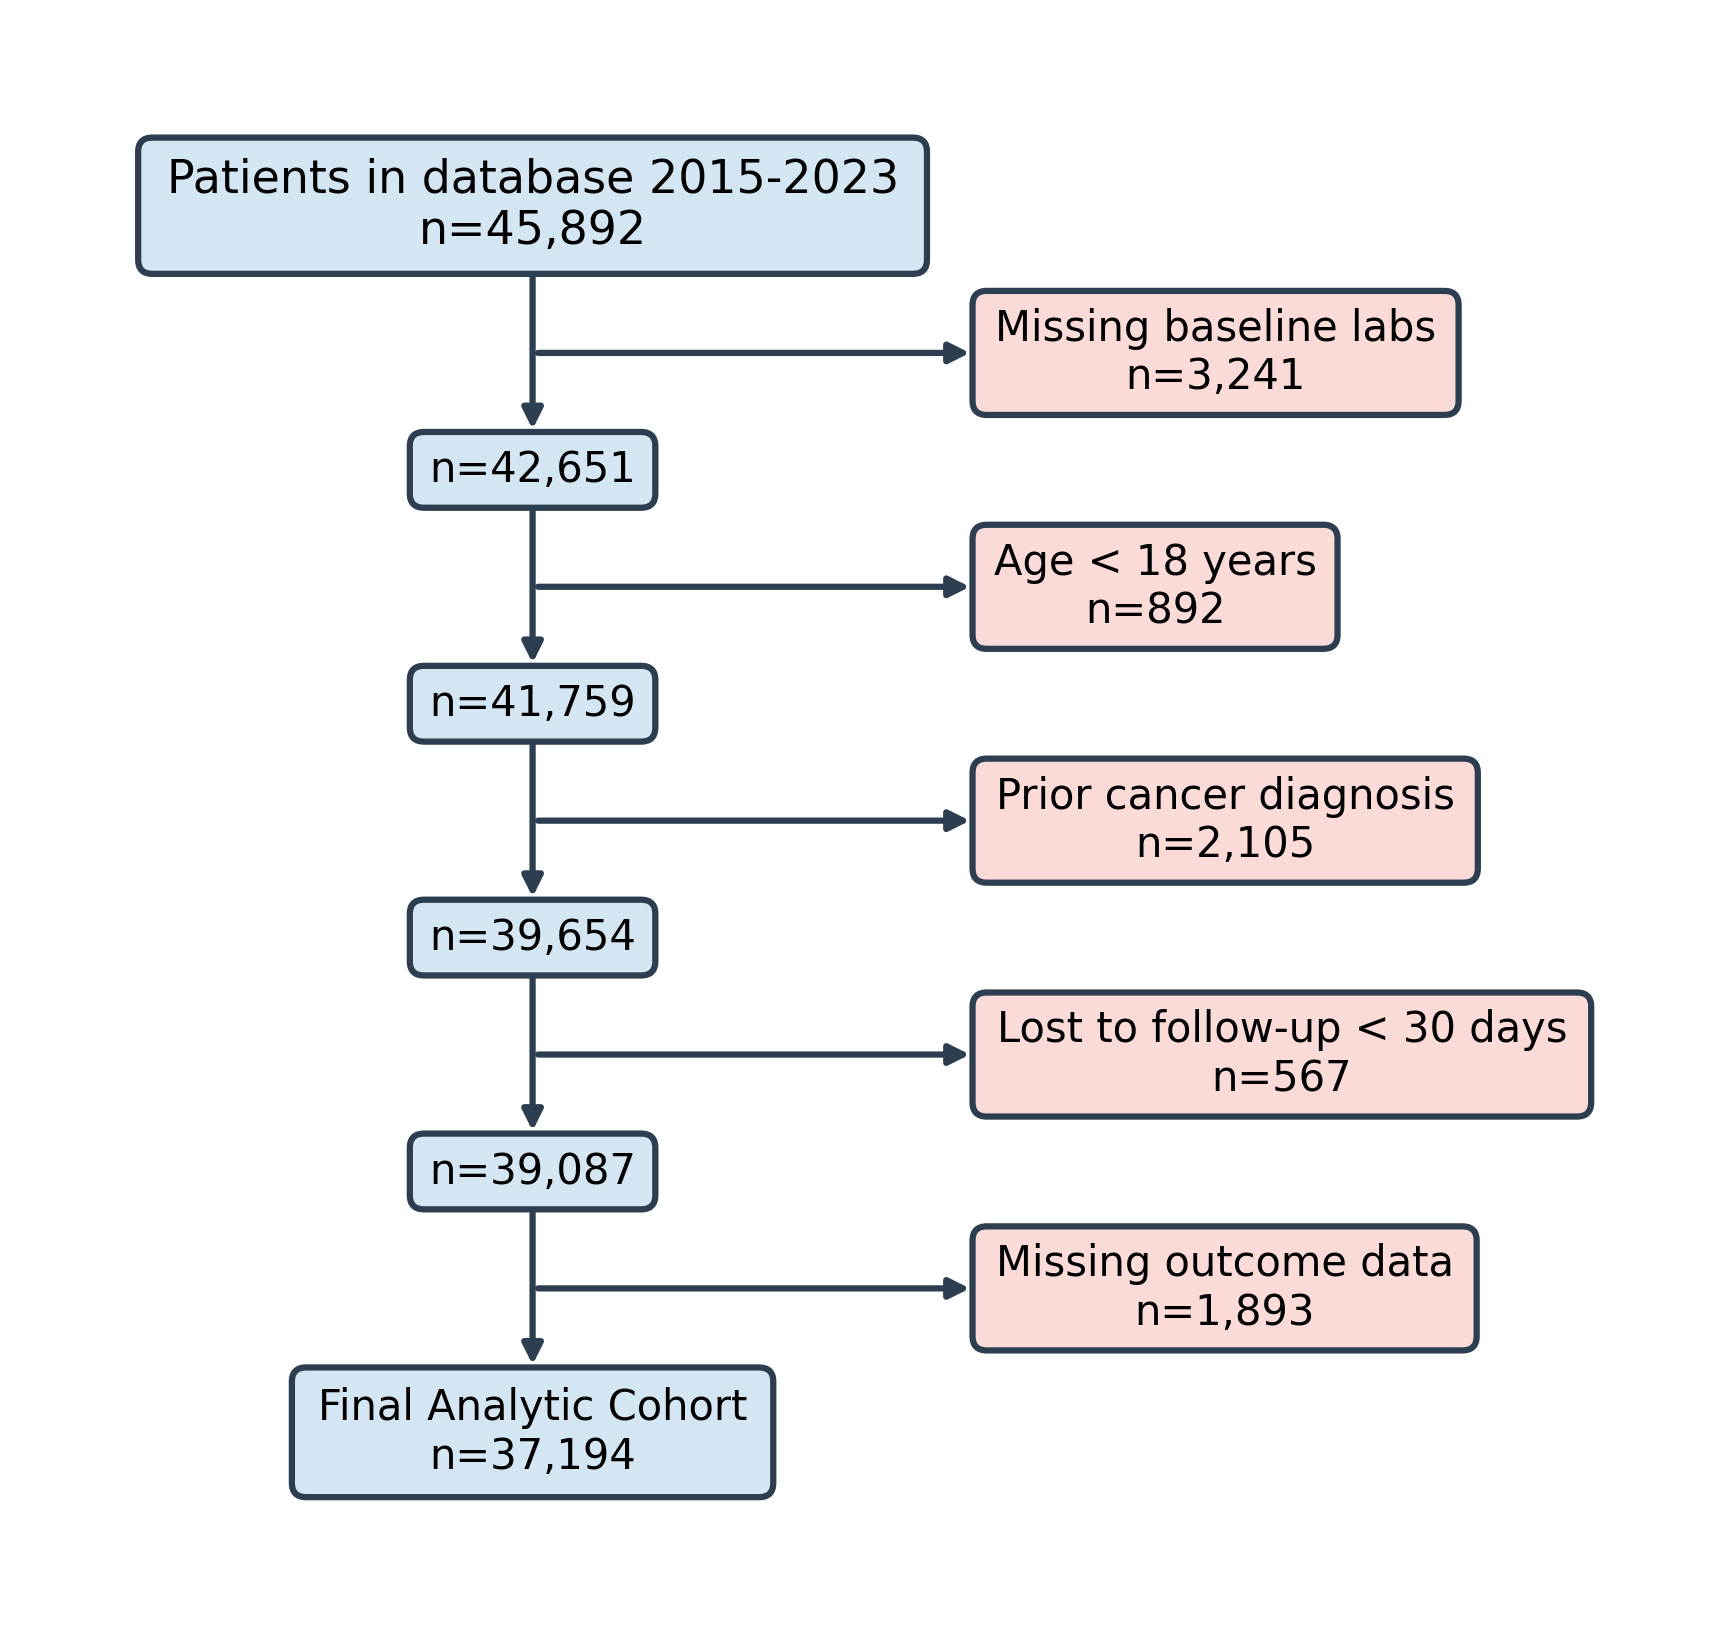
From a Stata-Tools checkout, run stata-mp -b do consort/demo/demo_consort.do from the repository root to regenerate the shipped figures and the CSV/XLSX export example. The demo script is a checkout workflow for documentation assets; it is not part of the net install payload.
| Output | Focus |
|---|---|
 |
Sequential exclusions, shading, and high-DPI output |
 |
csv() and xlsx() output from the same workflow |
Command Reference
consort init
consort init, initial(string) [file(filename)]
Starts a diagram with the current number of observations. With no file(), the command uses a temporary backing CSV; with file(), it writes the raw exclusion record to the requested path. Only one diagram can be active at a time.
consort exclude
consort exclude if exp, label(string) [remaining(string)]
Counts and drops observations satisfying if exp, then appends the exclusion label and count to the backing CSV. The remaining() label applies to the population box after that step. The command requires an active diagram.
consort save
consort save, output(filename) [final(string) shading python(path) dpi(#) csv(filename) xlsx(filename)]
Renders the backing CSV through consort_diagram.py and writes the image to output(). At least one nonempty exclusion step is required. The output directory and any directories used by csv() or xlsx() must already exist.
The optional data exports are resolved from the same backing CSV used for the figure. They contain step, cohort_label, n_remaining, exclusion_label, n_excluded, and pct_of_initial.
consort clear
consort clear [, quiet]
Removes the active diagram state and deletes a temporary backing CSV. The quiet option suppresses the confirmation message. An explicitly supplied file() is not treated as temporary.
Key Options
Initialization options
| Option | Default | Description |
|---|---|---|
initial(string) |
Required | Label for the initial population box |
file(filename) |
Temporary CSV | Path for the raw backing CSV with label,n,remaining columns; the parent directory must already exist |
Exclusion options
| Option | Default | Description |
|---|---|---|
label(string) |
Required | Label for the observations excluded by the if condition |
remaining(string) |
Empty | Label for the remaining population box after the exclusion; intermediate boxes without it show the count only |
Save options
| Option | Default | Description |
|---|---|---|
output(filename) |
Required | Image path; PNG is recommended, and other formats supported by matplotlib may work |
final(string) |
"Final Cohort" when no final milestone label exists |
Label for the last population box; an explicitly supplied value overrides a remaining() label on the last exclusion |
shading |
Off | Applies light-blue shading to flow boxes and light-red shading to exclusion boxes |
python(path) |
python3 on Unix when found, otherwise python |
Python executable or path used to run the bundled renderer |
dpi(#) |
150 |
Positive image resolution in dots per inch |
csv(filename) |
Not written | Writes the resolved diagram table as CSV |
xlsx(filename) |
Not written | Writes the same resolved diagram table as an Excel workbook using Stata |
Clear options
| Option | Default | Description |
|---|---|---|
quiet |
Off | Suppresses the consort clear confirmation message |
Stored Results
consort init returns:
| Result | Type | Meaning |
|---|---|---|
r(N) |
Scalar | Initial number of observations |
r(initial) |
Local macro | Initial population label |
r(file) |
Local macro | Backing CSV path |
consort exclude returns r(n_excluded), r(n_remaining), and r(label) for every call. When at least one observation matches, it also returns r(step); for a zero-match condition, r(n_excluded) is 0 and no step is recorded.
| Result | Type | Meaning |
|---|---|---|
r(n_excluded) |
Scalar | Number of observations excluded in the call |
r(n_remaining) |
Scalar | Number of observations remaining after the call, or the current count for a zero-match call |
r(step) |
Scalar | Exclusion step number when the call records a step |
r(label) |
Local macro | Exclusion label |
consort save returns:
| Result | Type | Meaning |
|---|---|---|
r(N_initial) |
Scalar | Initial number of observations |
r(N_final) |
Scalar | Number of observations remaining at save time |
r(N_excluded) |
Scalar | Total number excluded |
r(steps) |
Scalar | Number of recorded exclusion steps |
r(output) |
Local macro | Image output path |
r(final) |
Local macro | Final-label argument; defaults to "Final Cohort" when final() is omitted |
r(csv) |
Local macro | CSV export path, only when csv() is requested |
r(xlsx) |
Local macro | Excel export path, only when xlsx() is requested |
When final() is omitted and the last exclusion has a nonempty remaining() label, that milestone label is retained in the diagram; r(final) still reports the default "Final Cohort" value.
Assumptions and Limits
consort excludepermanently drops matching observations from the active dataset. Usepreservebeforeconsort initandrestoreafterconsort savewhen the original data must remain in memory.- Exclusions are sequential and their order affects both the counts and the diagram. Do not manually drop or modify observations between
consort excludecalls unless you intentionally accept responsibility for keeping the recorded counts aligned. - A zero-match condition is skipped rather than recorded.
consort savealso requires at least one recorded exclusion step. - Only one diagram can be active at a time. Use
consort clearto abandon the current state before starting another workflow. - The output image and requested companion files are replaced when generated. Create their parent directories before calling
consort save. - If you edit a backing CSV supplied through
file(), preserve itslabel,n,remainingstructure. The image and resolved exports follow that file, while the Stata summary counts the observations currently in memory.
Troubleshooting
Python is not found
Check the executables visible to Stata:
shell python --version
shell python3 --version
Then pass the working executable or full path explicitly:
consort save, output("diagram.png") python("/usr/local/bin/python3")
matplotlib is not installed
Install it into the environment used by the same executable passed to python():
shell python -m pip install matplotlib
Use shell python3 -m pip install matplotlib when python3 is the executable Stata can access.
The output directory does not exist
Create the directory before saving, or write the output to the current working directory:
capture mkdir "results"
consort save, output("results/diagram.png")
The directories for csv() and xlsx() must also exist before save runs.
No exclusion step is recorded
Confirm that consort init ran successfully and that at least one if condition matches observations. Conditions matching zero observations are deliberately skipped and do not satisfy the requirement for consort save.
References
The package uses the CONSORT naming convention for participant-flow diagrams; consult the CONSORT Statement and the reporting guidance for your study design when adapting the figure.
QA
QA suites are available in qa/.
Version History
- 1.1.1 (2026-08-05): Clarify final-label return behavior, output-directory requirements, and runnable help examples.
- 1.1.0 (2026-06-24): Add
csv()andxlsx()options toconsort savefor writing a resolved, machine-readable table of the diagram data (one row per node) alongside the figure; paths returned inr(csv)/r(xlsx) - 1.0.0 (2026-04-08): Initial Stata-Tools release for stateful CONSORT-style flowchart generation from Stata
Author
Timothy P Copeland, Karolinska Institutet
License
MIT