Version 1.0.0 | 2026-04-08
mvp analyzes missing-data structure across variables, reports distinct missingness patterns, and can graph missingness as bar charts, pattern-frequency charts, observation-by-variable heatmaps, and missingness-correlation heatmaps. It is a Stata 16+ fork of mvpatterns with added graphing, stratification, generated indicators, and monotone-pattern diagnostics.
Requirements
- Stata 16 or later
- No external dependencies. When
tetrachoricis unavailable,mvp, correlatefalls back to Pearson correlations among missingness indicators.
Installation
capture ado uninstall mvp
net install mvp, from("https://raw.githubusercontent.com/tpcopeland/Stata-Tools/main/mvp") replace
Commands
| Command | Description |
|---|---|
mvp |
Summarize, test, save, and graph missing value patterns |
How It Works
- If you omit
varlist,mvpanalyzes all variables in memory and drops variables with no missing values from the pattern display unless you specifynodrop. - The main text output has two layers: a variable-level missingness summary and a pattern table where
+means observed and.means missing. generate(stub)creates one missingness indicator per analyzed variable plusstub_patternandstub_nmissfor downstream analysis.save(name)stores the pattern dataset either in a Stata frame or in a.dtafile, depending on the name you supply.graph(bar),graph(patterns),graph(matrix), andgraph(correlation)provide four complementary views of missingness.gby()andover()let you compare groups inside the graph workflows.
Worked Examples
1. Quick audit of missingness in a built-in dataset
sysuse auto is a good first check because rep78 has missing values and the example runs immediately after installation.
sysuse auto, clear
mvp price mpg rep78 headroom trunk, percent sort
Use this pattern when you want a fast table of missingness by variable and by pattern before modeling or imputation planning.
2. Generate missingness indicators and save the pattern data
This workflow is useful when you want to reuse the missingness structure later in the same Stata session.
sysuse auto, clear
mvp price mpg rep78, generate(m) save(patterns)
tab m_pattern
frame patterns: list
3. Compare missingness across groups with a graph
gby() creates faceted graphs so you can see whether missingness changes across categories.
sysuse auto, clear
mvp price mpg rep78, graph(bar) gby(foreign)
4. Check monotonicity and co-occurring missingness in a richer synthetic example
For monotone checks and correlation heatmaps, it helps to have several variables with distinct missingness rates.
clear
set seed 12345
set obs 300

gen age = rnormal(50, 12)
gen female = runiform() < 0.5
gen bmi = rnormal(27, 5)
gen sbp = rnormal(130, 18)
gen ldl = rnormal(3.5, 1.1)
gen hba1c = rnormal(5.8, 0.9)

replace bmi = . if runiform() < 0.08
replace sbp = . if runiform() < 0.05
replace ldl = . if runiform() < 0.15
replace hba1c = . if runiform() < 0.20
replace hba1c = . if missing(ldl) & runiform() < 0.4

mvp age female bmi sbp ldl hba1c, percent sort monotone correlate
mvp bmi sbp ldl hba1c, graph(correlation) textlabels
Graph Workflows
| Workflow | What it shows |
|---|---|
graph(bar) |
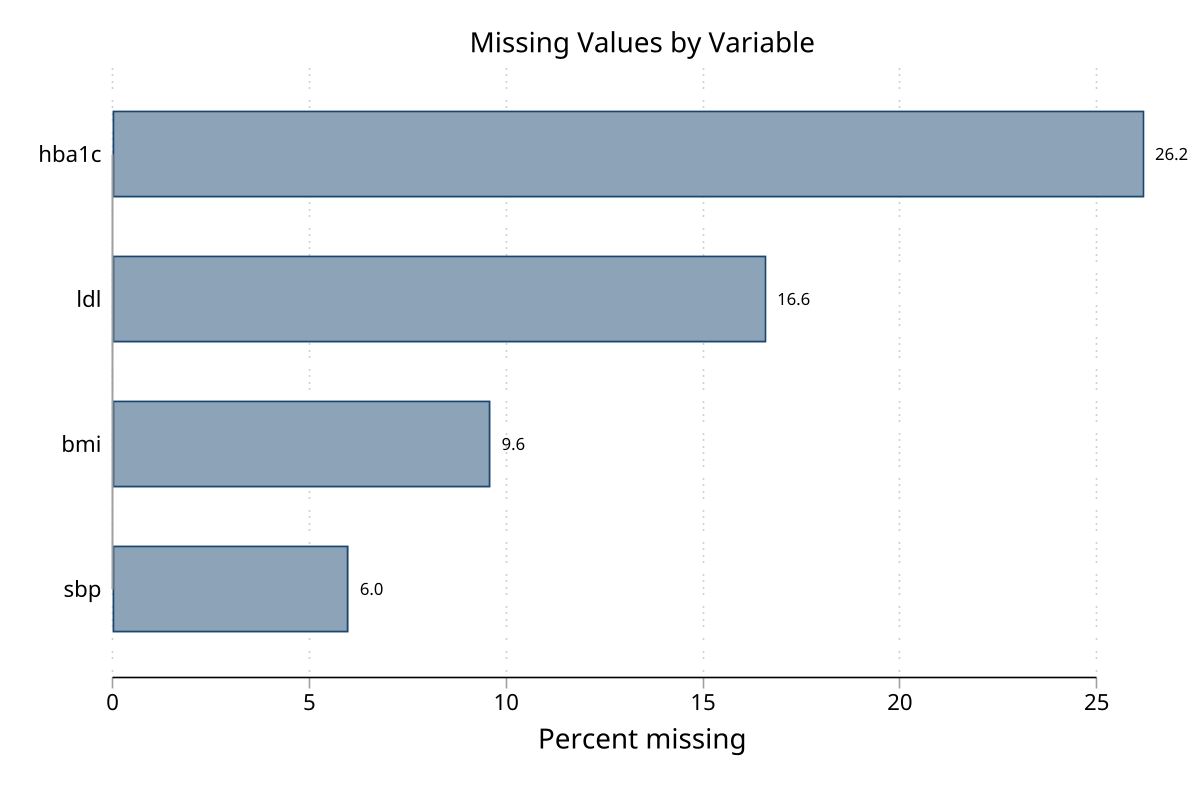
Percent missing by variable |
graph(patterns) |
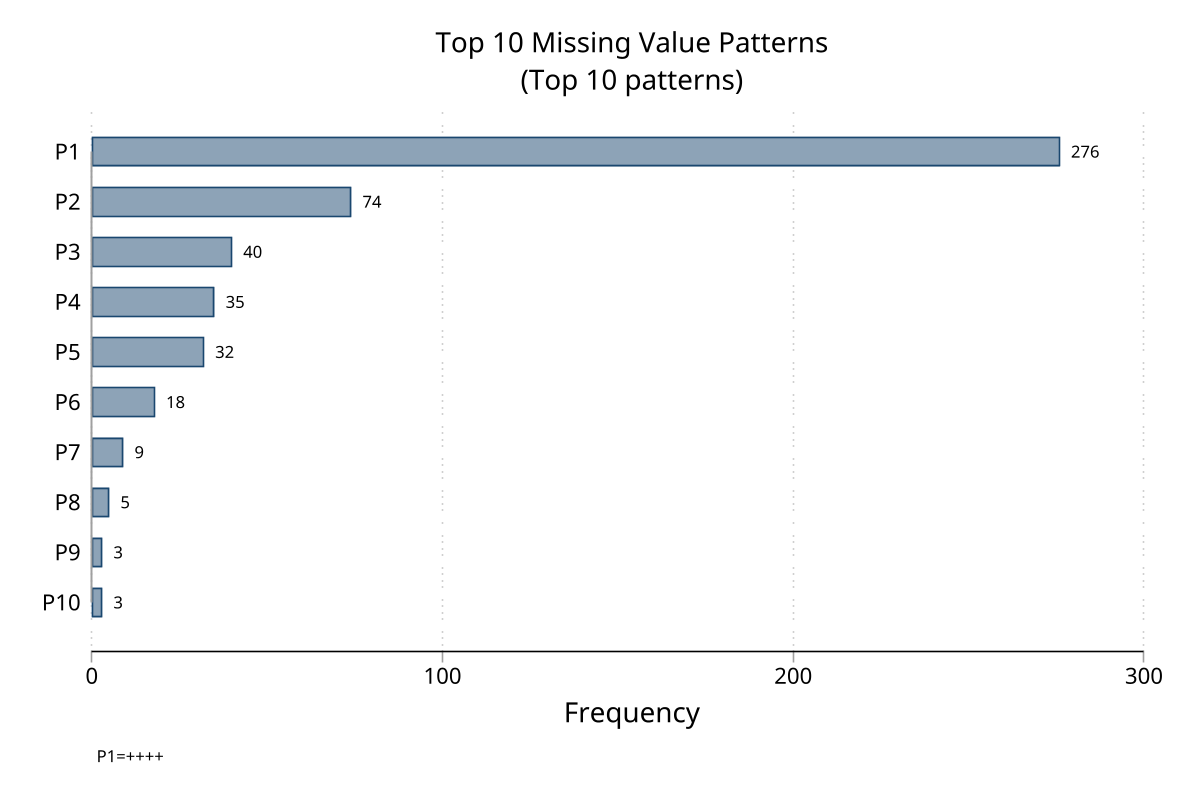
Frequencies of the most common missingness patterns |
graph(matrix) |
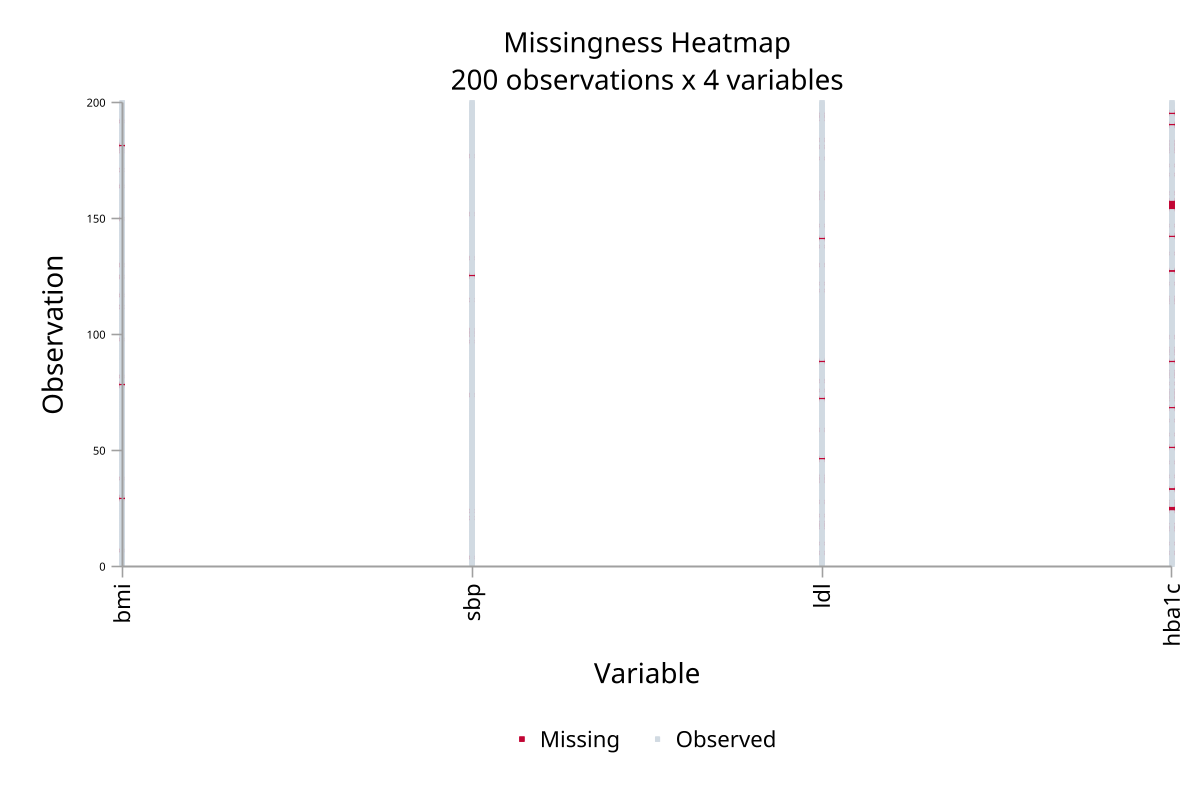
Observation-by-variable missingness heatmap |
graph(correlation) |
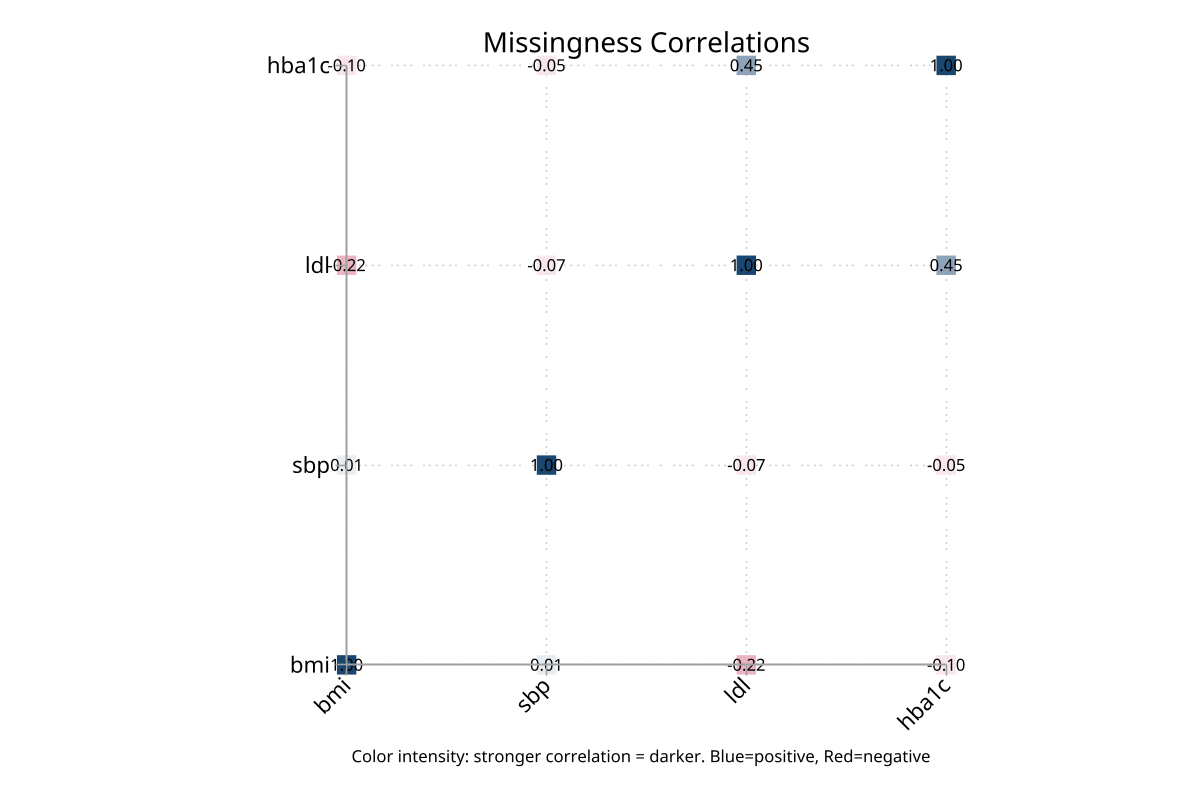
Correlation matrix of missingness indicators |
For large datasets, graph(matrix) samples 500 observations by default. Use graph(matrix, sample(#)) to change that, and add sort inside graph(matrix, sort) when you want observations grouped by pattern.
Demo
Console output — pattern analysis with monotone test and correlations (click to expand)
. mvp age female bmi sbp ldl hba1c, percent sort monotone correlate
Variables with no missing: age female

Variable     | Type     Obs    Miss   %Miss   Variable label
-------------+-----------------------------------------
hba1c        |  double    369    131   26.2   HbA1c
ldl          |  double    417     83   16.6   LDL cholesterol
bmi          |  double    452     48    9.6   Body mass index
sbp          |  double    470     30    6.0   Systolic BP
-------------------------------------------------------

Missing value patterns

  +----------------------------------+
  | _pattern   _miss   _freq    _pct |
  |----------------------------------|
  |     ++++       0     276   55.20 |
  |     .+++       1      74   14.80 |
  |     ..++       2      40    8.00 |
  |     +.++       1      35    7.00 |
  |     ++.+       1      32    6.40 |
  |     +++.       1      18    3.60 |
  |     .+.+       2       9    1.80 |
  |     .++.       2       5    1.00 |
  |     ++..       2       3    0.60 |
  |     +..+       2       3    0.60 |
  |     +.+.       2       2    0.40 |
  |     ..+.       3       2    0.40 |
  |     ...+       3       1    0.20 |
  +----------------------------------+

--------------------------------------------------
Total observations:             500
Complete cases:                 276  ( 55.2%)
Incomplete cases:               224  ( 44.8%)
Unique patterns:                 13
Variables analyzed:               4
Max missing/obs:                  3
Mean missing/obs:              0.58
--------------------------------------------------

Monotone missingness test:
  Observations with monotone pattern:      297 ( 59.4%)
  Pattern is non-monotone

Tetrachoric correlations of missingness:
(correlations among missingness indicators)

        hba1c     ldl     bmi     sbp
hba1c   1.000
  ldl   0.453   1.000
  bmi  -0.097  -0.217   1.000
  sbp  -0.045  -0.070   0.012   1.000
Graph gallery
Bar chart — % missing by variable (click to expand)
Pattern frequency chart — top 10 patterns
Matrix heatmap — observation × variable
Correlation heatmap — missingness indicators
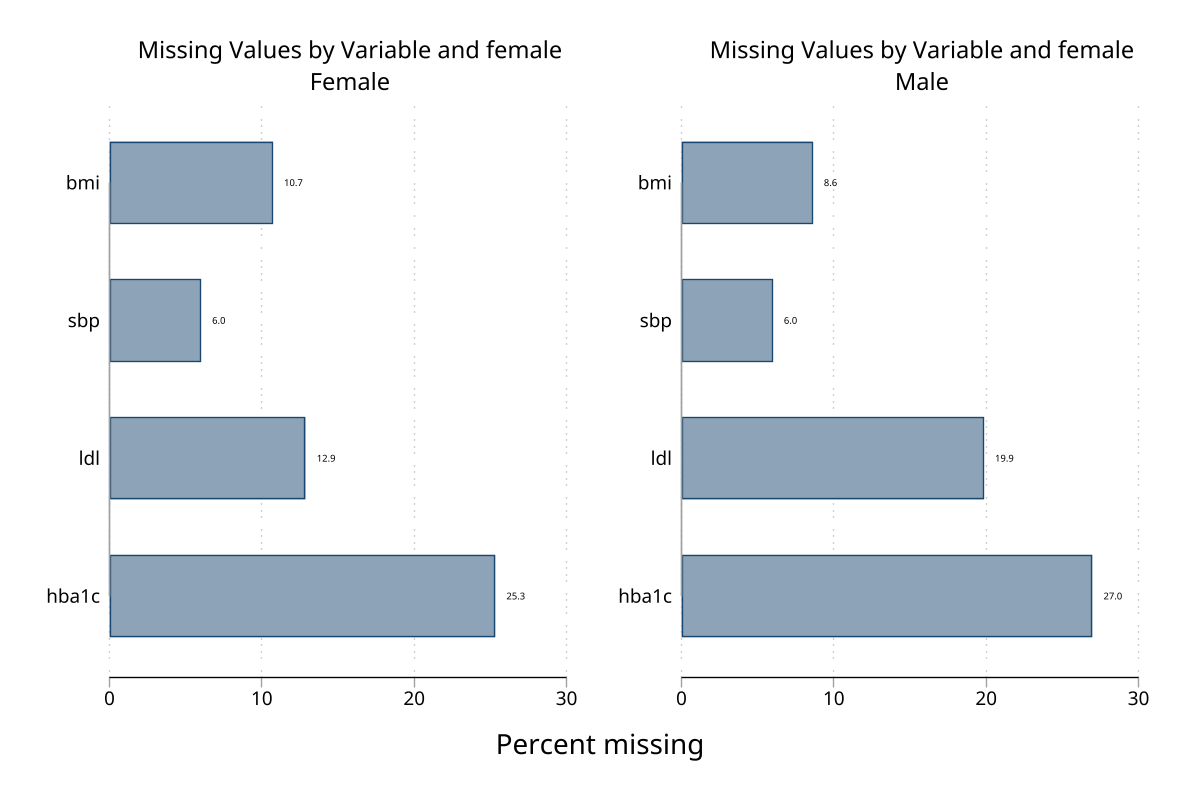
Stratified bar chart — by sex (2 groups)
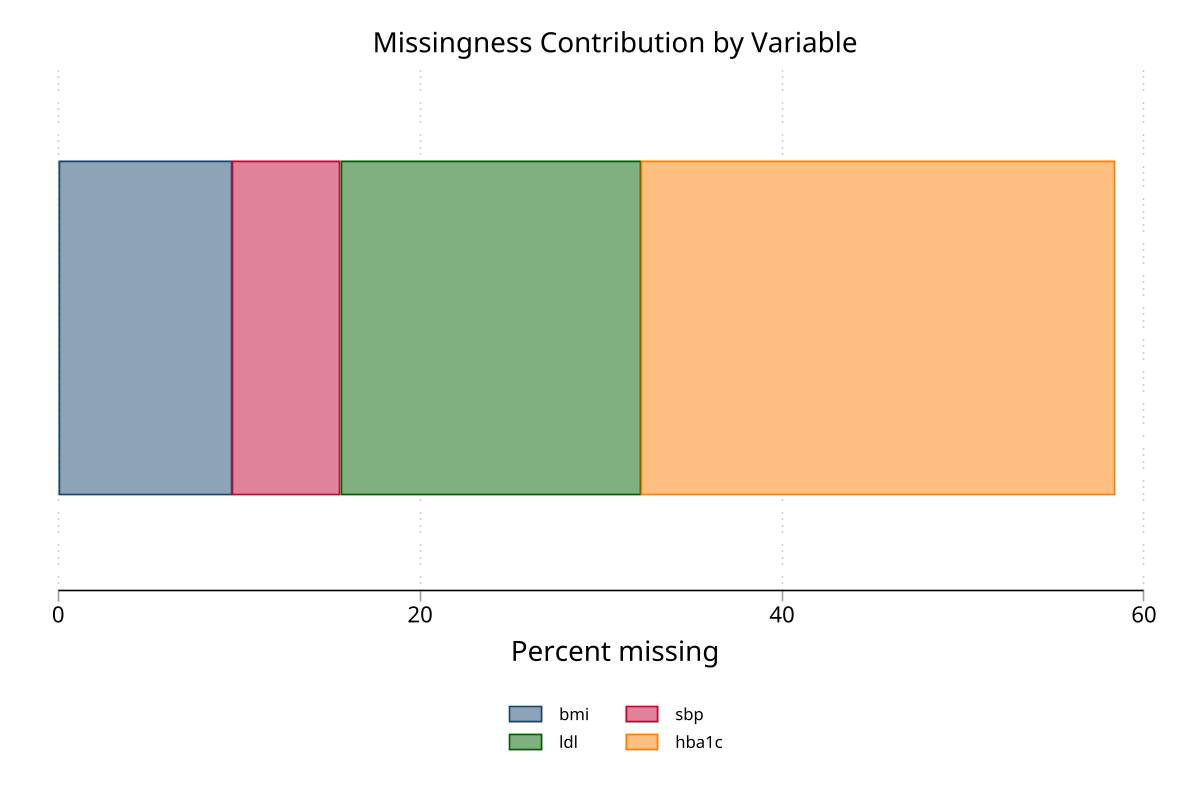
Stacked bar chart — variable contributions
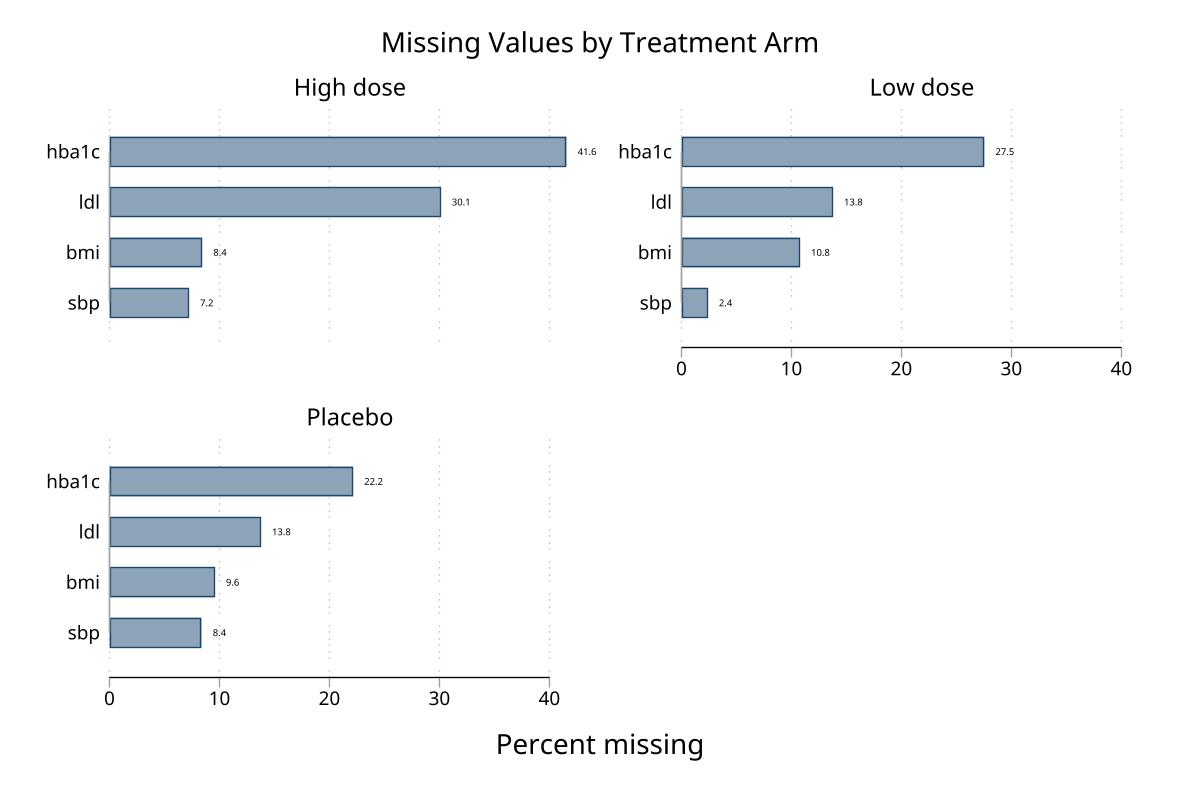
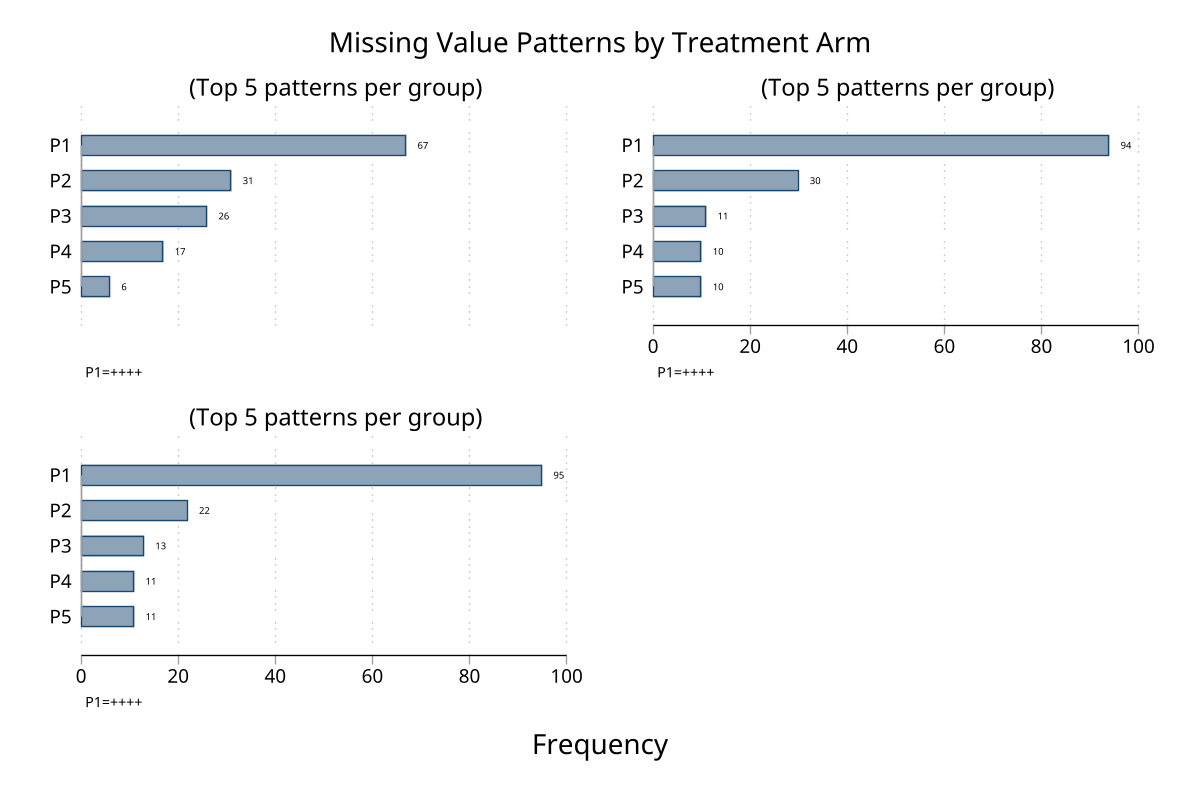
Multiple treatment groups
The gby() and over() options support any number of groups. Here the dataset has 3 treatment arms (Placebo, Low dose, High dose) with the high-dose arm receiving extra lab dropout missingness.
Faceted bar chart — gby(arm) (click to expand)
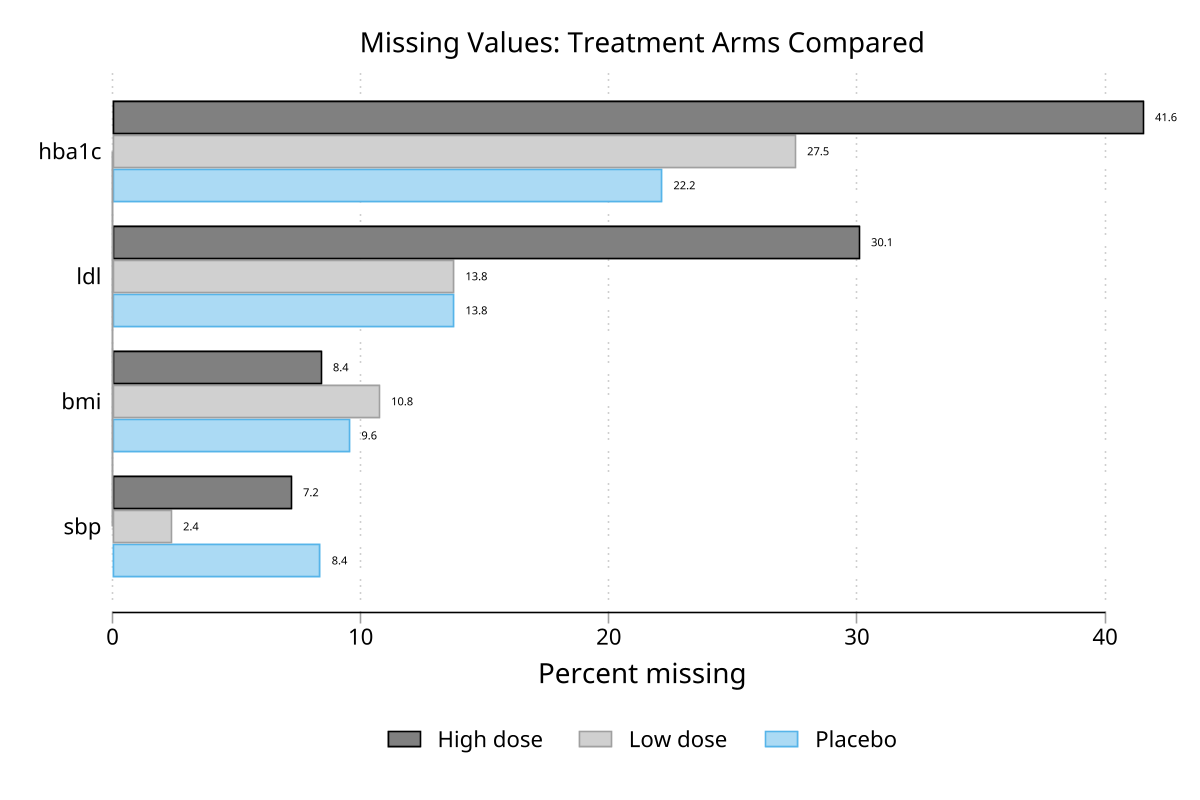
Overlay bar chart — over(arm)
Faceted pattern chart — gby(arm)
Per-arm console output (click to expand)
. mvp bmi sbp ldl hba1c if arm == 0, percent sort // Placebo
Variable     | Type     Obs    Miss   %Miss   Variable label
-------------+-----------------------------------------
hba1c        |  double    130     37   22.2   HbA1c
ldl          |  double    144     23   13.8   LDL cholesterol
bmi          |  double    151     16    9.6   Body mass index
sbp          |  double    153     14    8.4   Systolic BP
-------------------------------------------------------

Complete cases:           95  ( 56.9%)    Unique patterns: 10
. mvp bmi sbp ldl hba1c if arm == 1, percent sort // Low dose
Variable     | Type     Obs    Miss   %Miss   Variable label
-------------+-----------------------------------------
hba1c        |  double    121     46   27.5   HbA1c
ldl          |  double    144     23   13.8   LDL cholesterol
bmi          |  double    149     18   10.8   Body mass index
sbp          |  double    163      4    2.4   Systolic BP
-------------------------------------------------------

Complete cases:           94  ( 56.3%)    Unique patterns: 8
. mvp bmi sbp ldl hba1c if arm == 2, percent sort // High dose
Variable     | Type     Obs    Miss   %Miss   Variable label
-------------+-----------------------------------------
hba1c        |  double     97     69   41.6   HbA1c
ldl          |  double    116     50   30.1   LDL cholesterol
bmi          |  double    152     14    8.4   Body mass index
sbp          |  double    154     12    7.2   Systolic BP
-------------------------------------------------------

Complete cases:           67  ( 40.4%)    Unique patterns: 13
Regenerate with:
do mvp/demo/demo_mvp.do
Selected Returned Results
mvp stores several useful summaries in r(), including:
r(N): observations analyzedr(N_complete)andr(N_incomplete): complete and incomplete casesr(N_patterns): number of unique patterns displayedr(N_vars): number of variables analyzedr(varlist): analyzed variables with missing valuesr(monotone_status): monotone or non-monotone whenmonotoneis requestedr(corr_miss): missingness correlation matrix whencorrelateorgraph(correlation)is used
Version History
- 1.0.0 (2026-04-08): Initial Stata-Tools release of the enhanced
mvpatternsfork with graphics, generated indicators, saved pattern data, and monotone diagnostics.
Author
Timothy P Copeland, Karolinska Institutet
Fork of mvpatterns version 2.0.0 by Jeroen Weesie.