tc_schemes
Reporting & VisualizationGraph schemes from blindschemes and schemepack
Version 1.1.1 | 2026-08-05
tc_schemes bundles 45 Stata graph schemes from blindschemes, schemepack, cleanplots, scheme-modern, and the original rdbu, ki, and ki_black schemes. It gives applied Stata users one installable catalog command for browsing schemes and checking that the package is present with which tc_schemes.
Quick Start
After installation, inspect the catalog and use a scheme on a graph:
tc_schemes
set scheme plotplain
sysuse auto, clear
scatter mpg weight, title("Fuel economy by vehicle weight")
Use scheme() to change one graph without changing the session default:
sysuse auto, clear
scatter mpg weight, scheme(white_tableau)
Requirements
- Stata 16 or later
- No external software or Stata package dependencies
Installation
capture ado uninstall tc_schemes
net install tc_schemes, from("https://raw.githubusercontent.com/tpcopeland/Stata-Tools/main/tc_schemes") replace
The installation includes the tc_schemes command and help file, 45 .scheme files, and 21 bundled .style color files.
Commands
| Command | Description |
|---|---|
tc_schemes |
Browse the installed scheme catalog, filter by source family, and display compact or detailed output |
How It Works
tc_schemes is a catalog and installation-check wrapper around the scheme files shipped with the package. It does not draw a graph itself; after browsing, apply a scheme globally with set scheme scheme_name or to one graph with scheme(scheme_name).
- With no options,
tc_schemesprints an organized overview of the five source families and the total number of selected schemes. source()narrows the catalog to one family:blindschemes,schemepack,cleanplots,modern, ortc. The default isall.listprints one selected scheme name per line;detailadds descriptions, attribution, and usage notes. These display options are mutually exclusive.which tc_schemessucceeds after installation, making the wrapper useful in project headers that need to check package presence.
The bundled scheme families are:
| Source | Schemes | Examples and use |
|---|---|---|
blindschemes |
4 | plotplain, plotplainblind, plottig, and plottigblind for clean publication figures and accessible palettes |
schemepack series |
27 | white_*, black_*, and gg_* variants of tableau, cividis, viridis, hue, brbg, piyg, ptol, jet, and w3d |
schemepack standalone |
8 | tab1, tab2, tab3, cblind1, ukraine, swift_red, neon, and rainbow |
cleanplots |
1 | A publication scheme designed to remain distinguishable in color and grayscale |
modern |
2 | modern and modern_dark, matplotlib-inspired defaults |
tc |
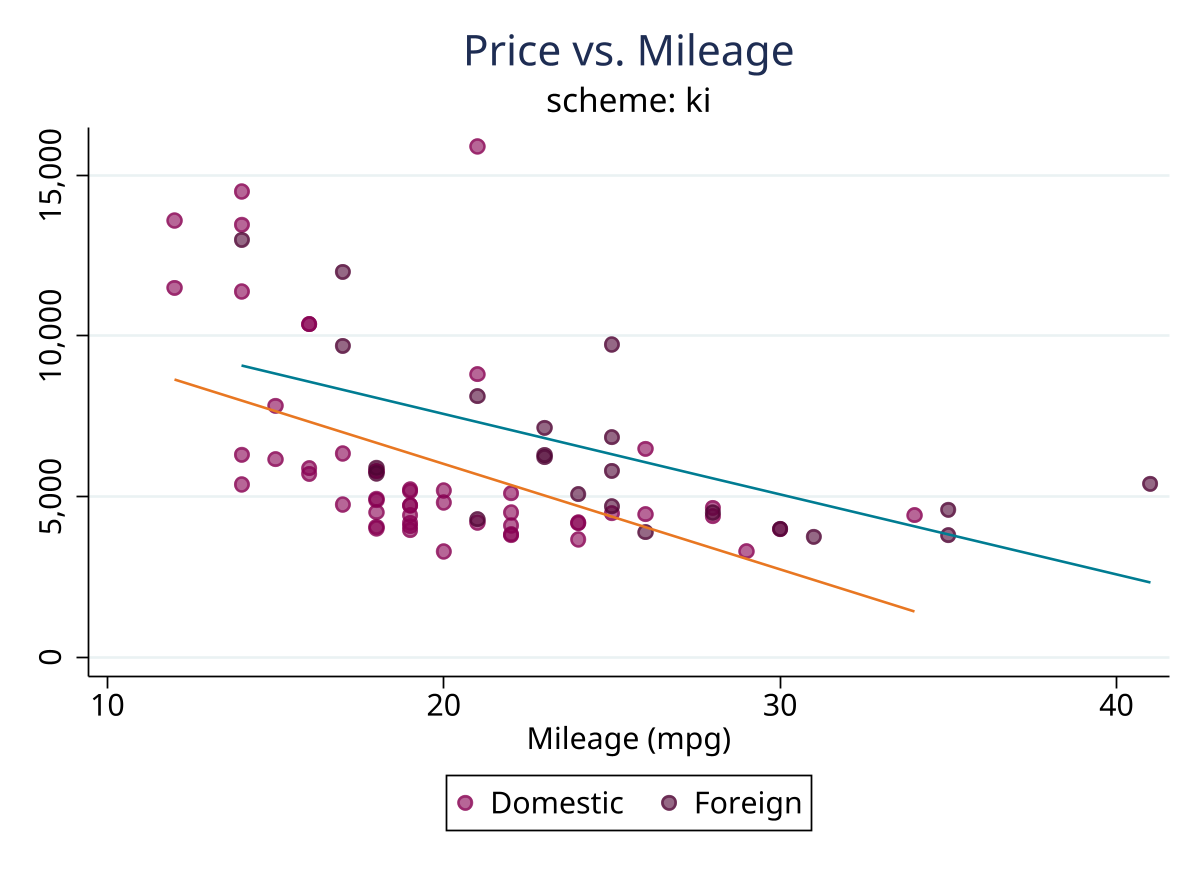
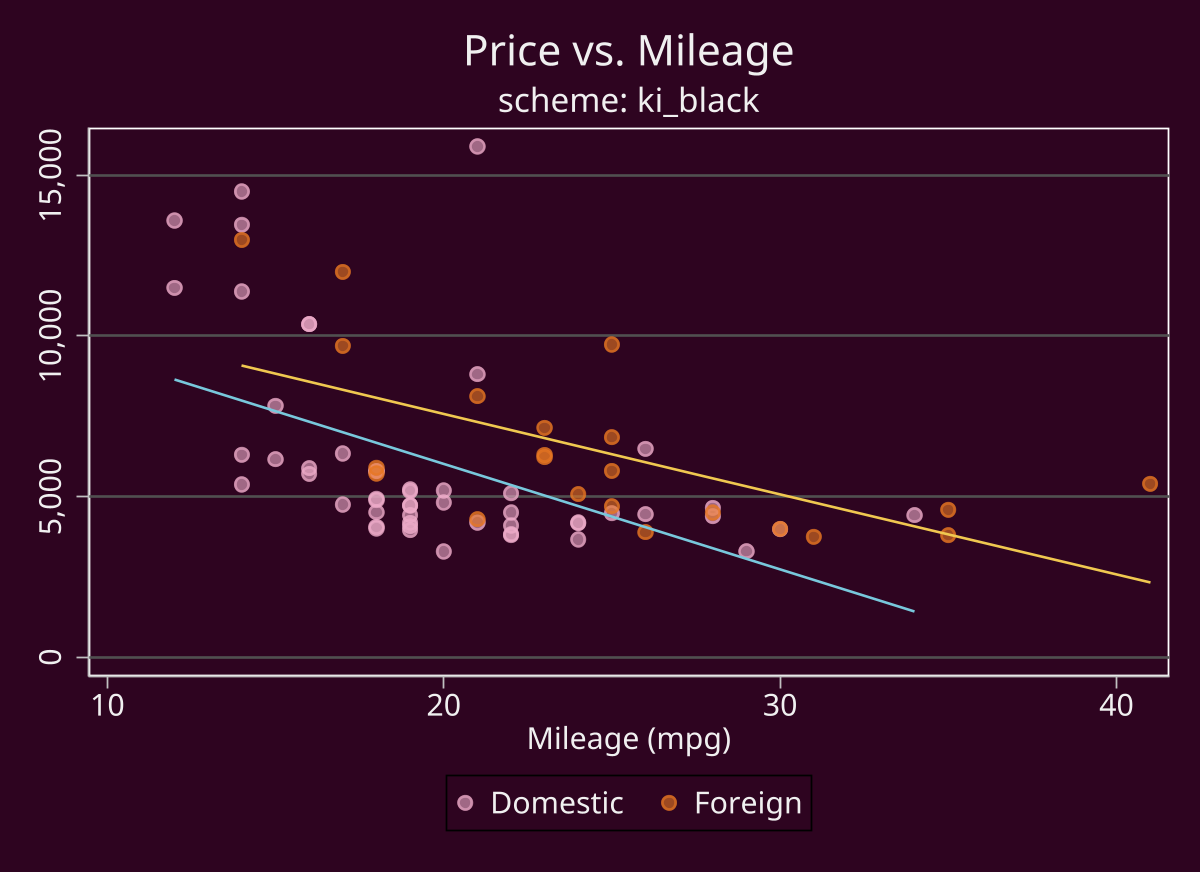
3 | rdbu, ki, and ki_black, the original schemes authored for this package |
The bundled color styles include vermillion, sky, turquoise, reddish, sea, orangebrown, ananas, and the plb1–plb3, plg1–plg3, plr1–plr2, ply1–ply3, and pll1–pll3 tone families.
Worked Examples
1. Browse and filter the catalog
Run the default overview, then request a compact list for one source and detailed descriptions for the original schemes:
tc_schemes
tc_schemes, source(schemepack) list
tc_schemes, source(tc) detail
2. Set a global scheme for the session
set scheme changes the default used by subsequent graphs until another scheme is selected.
set scheme plotplainblind
sysuse auto, clear
scatter mpg weight, title("Fuel economy by vehicle weight") xtitle("Vehicle weight") ytitle("Miles per gallon")
3. Apply a scheme to one graph
Use scheme() when you want a local override without changing the session default.
sysuse auto, clear
scatter mpg weight, scheme(white_viridis) title("Single-graph scheme override")
4. Compare two visual systems
Render the same data under two schemes and combine the named graphs for a side-by-side comparison.
sysuse auto, clear
scatter mpg weight, scheme(plotplain) name(g_plain, replace)
scatter mpg weight, scheme(gg_hue) name(g_hue, replace)
graph combine g_plain g_hue, col(2)
5. Check package presence in a do-file header
The wrapper provides a reliable command target for an installation check even though the package is primarily a collection of .scheme and .style files.
capture which tc_schemes
if _rc != 0 {
    capture ado uninstall tc_schemes
    net install tc_schemes, from("https://raw.githubusercontent.com/tpcopeland/Stata-Tools/main/tc_schemes") replace
}
Gallery
The previews below are generated by demo/demo_tc_schemes.do using sysuse auto. Run that script from a repository checkout to regenerate the checked-in PNG assets.
| Preview | Scheme focus |
|---|---|
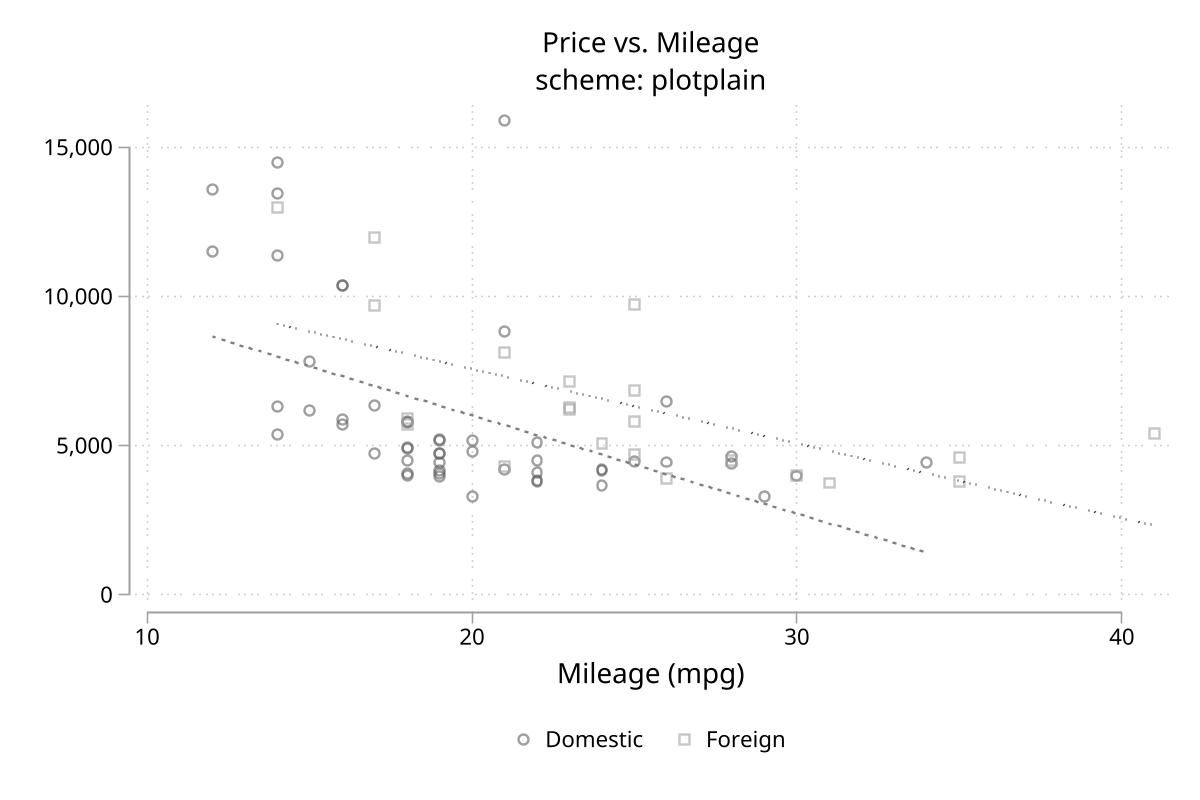 |
plotplain |
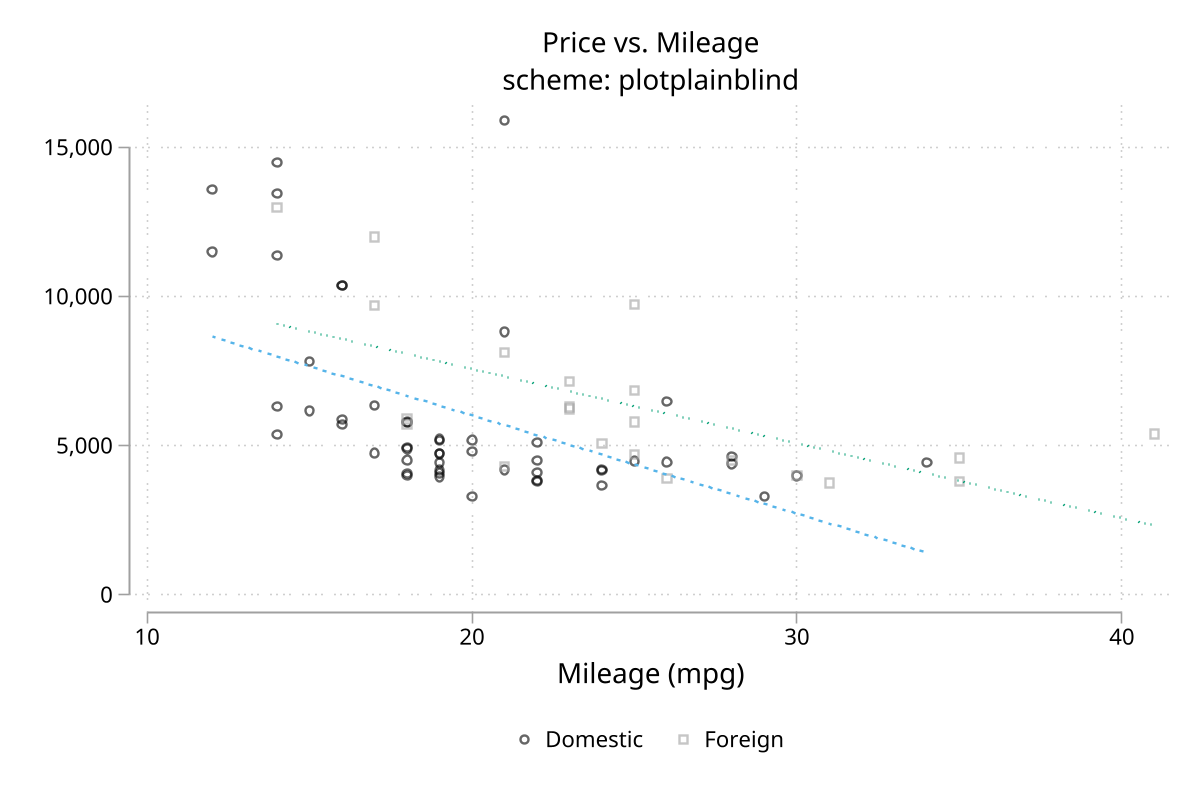 |
plotplainblind |
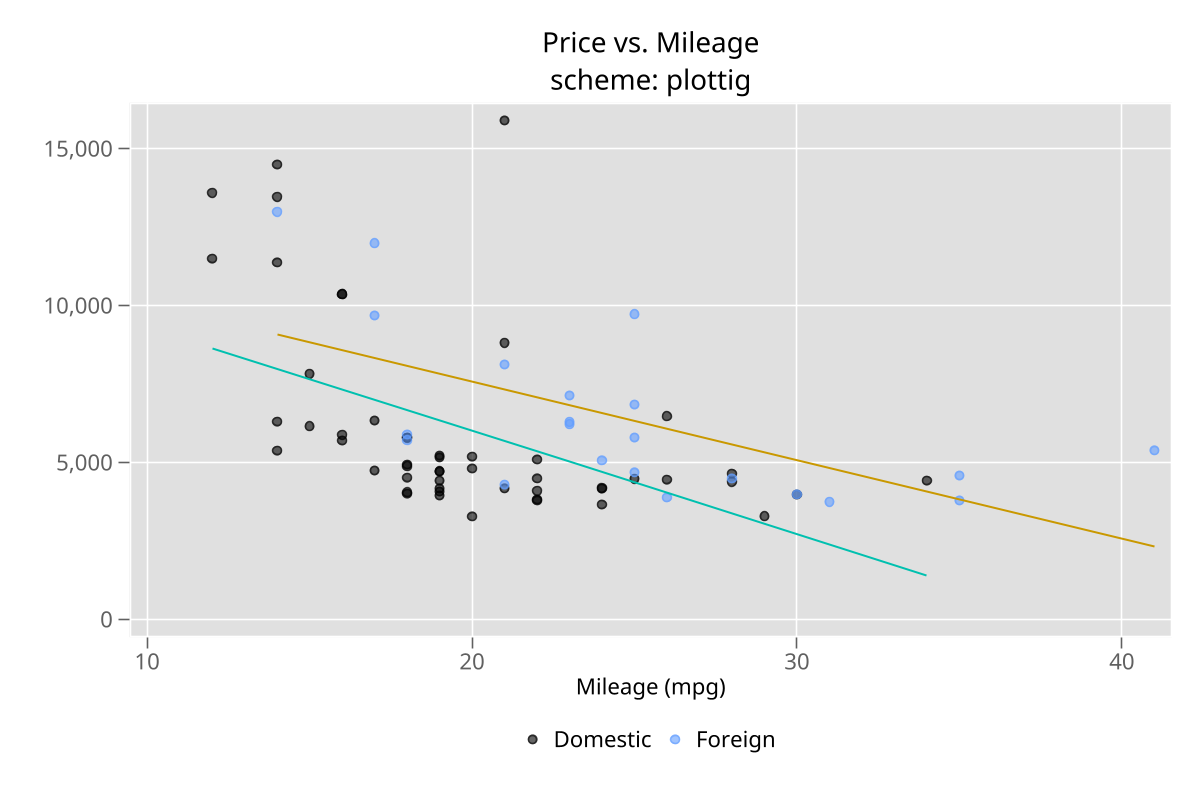 |
plottig |
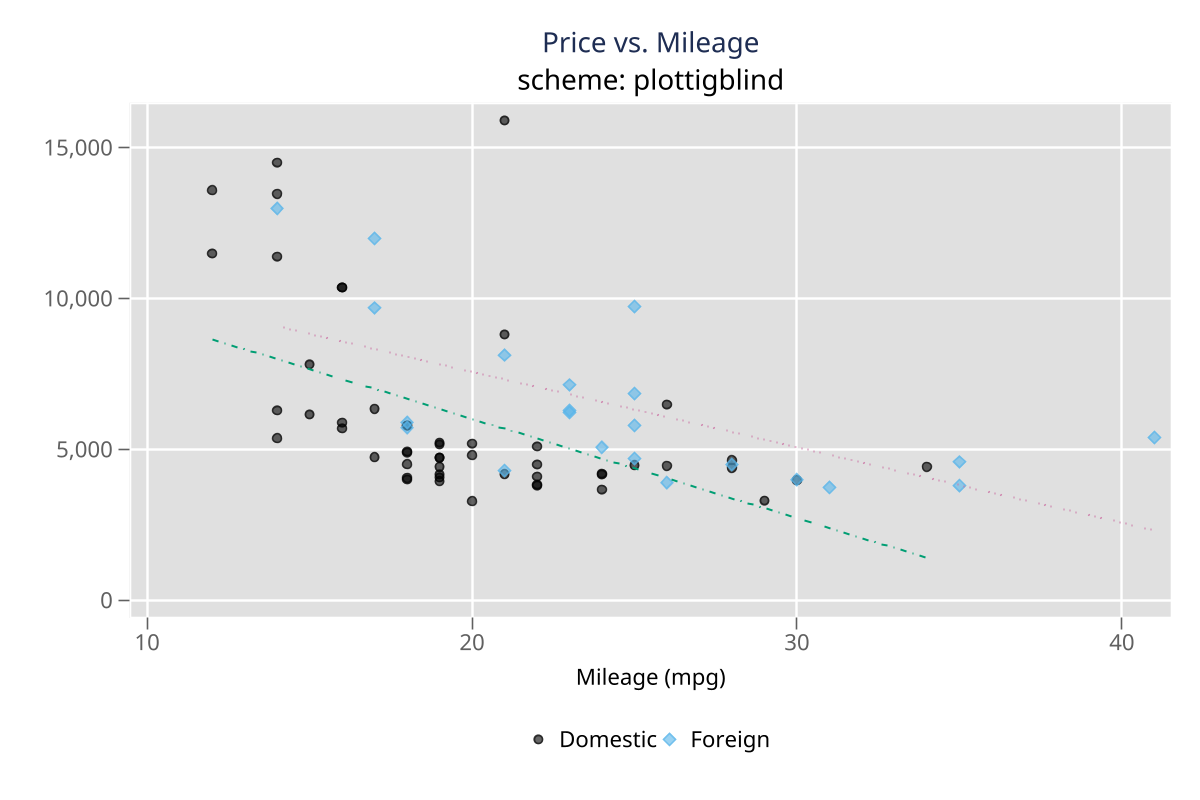 |
plottigblind |
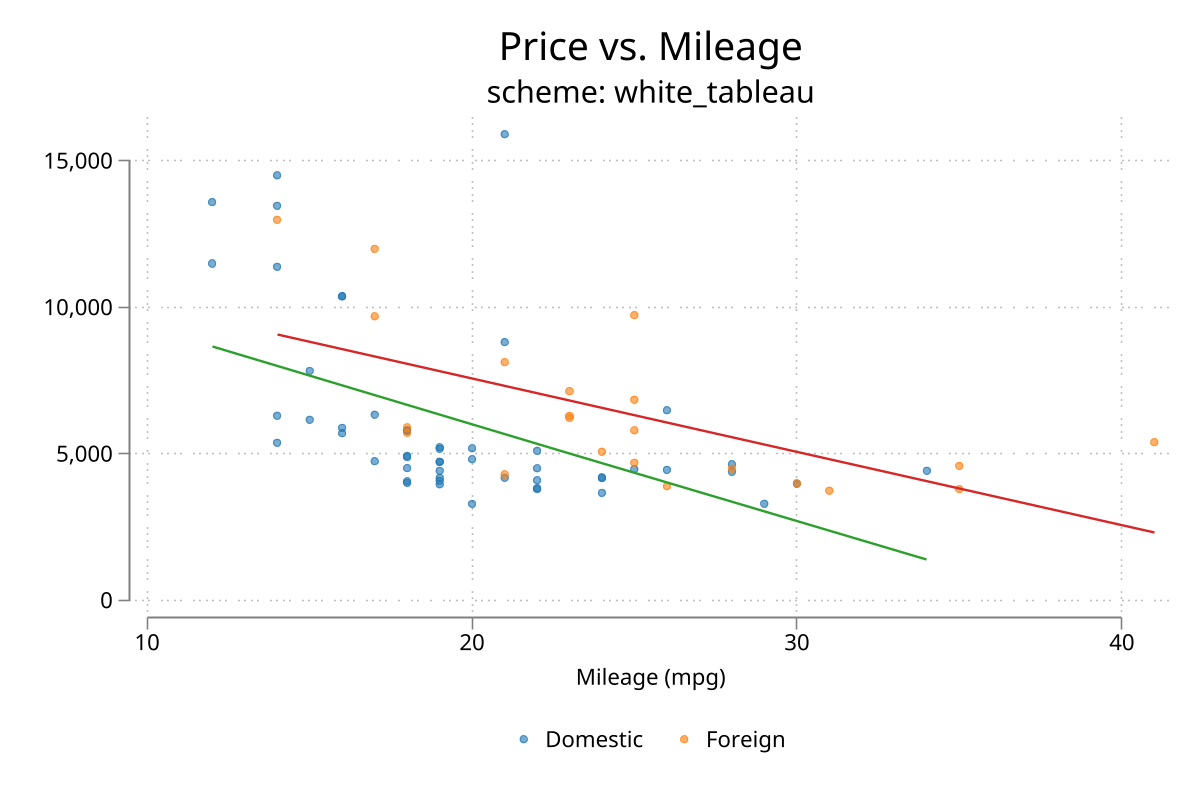 |
white_tableau |
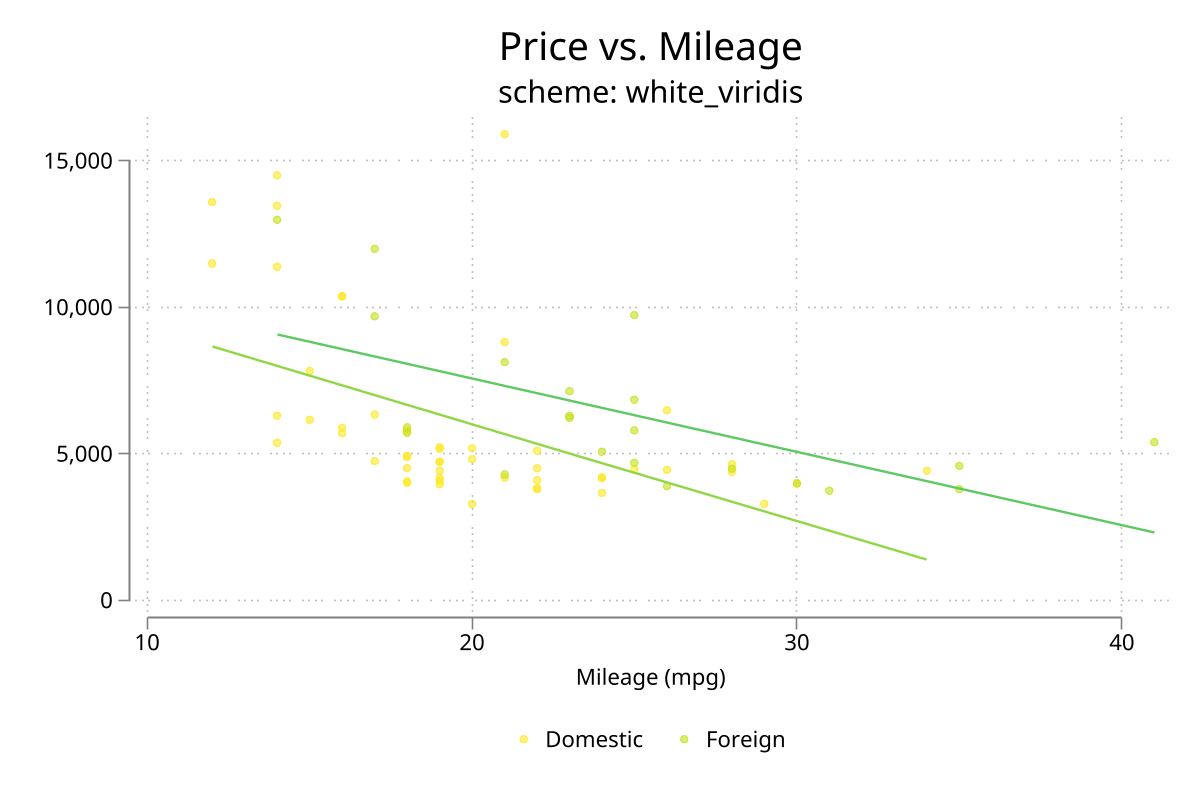 |
white_viridis |
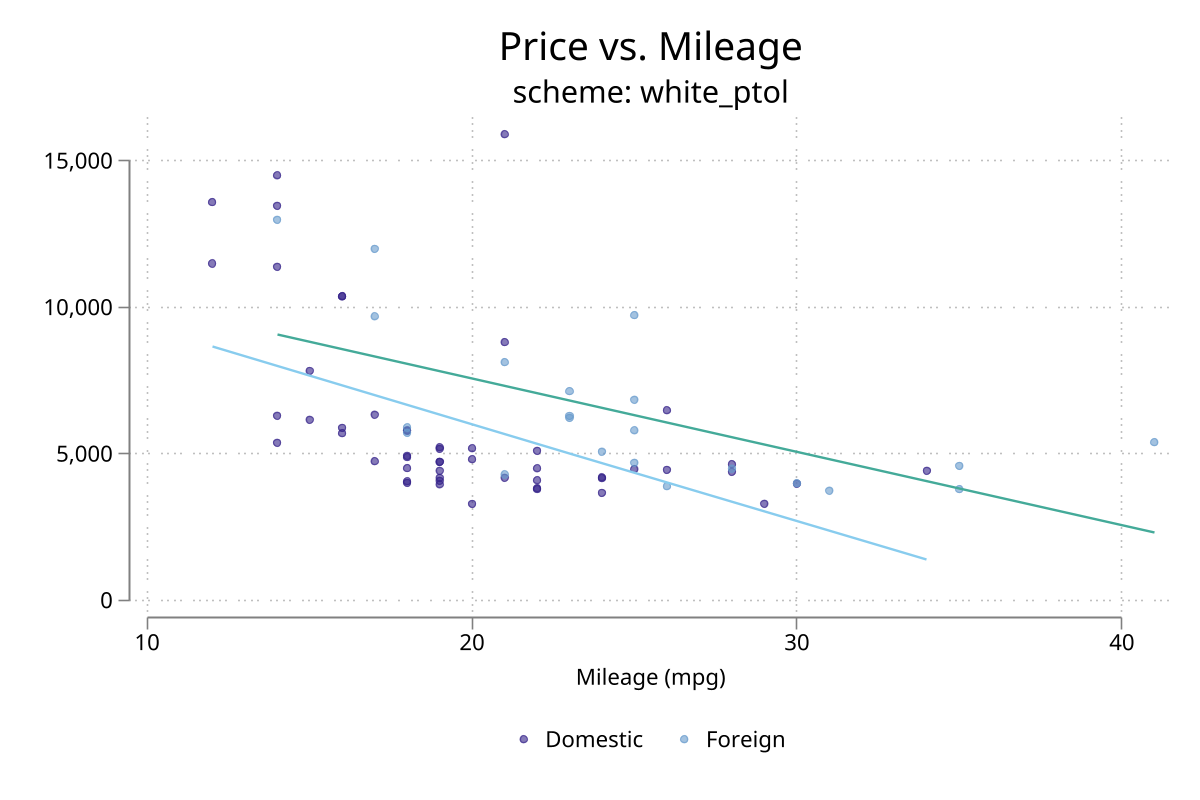 |
white_ptol |
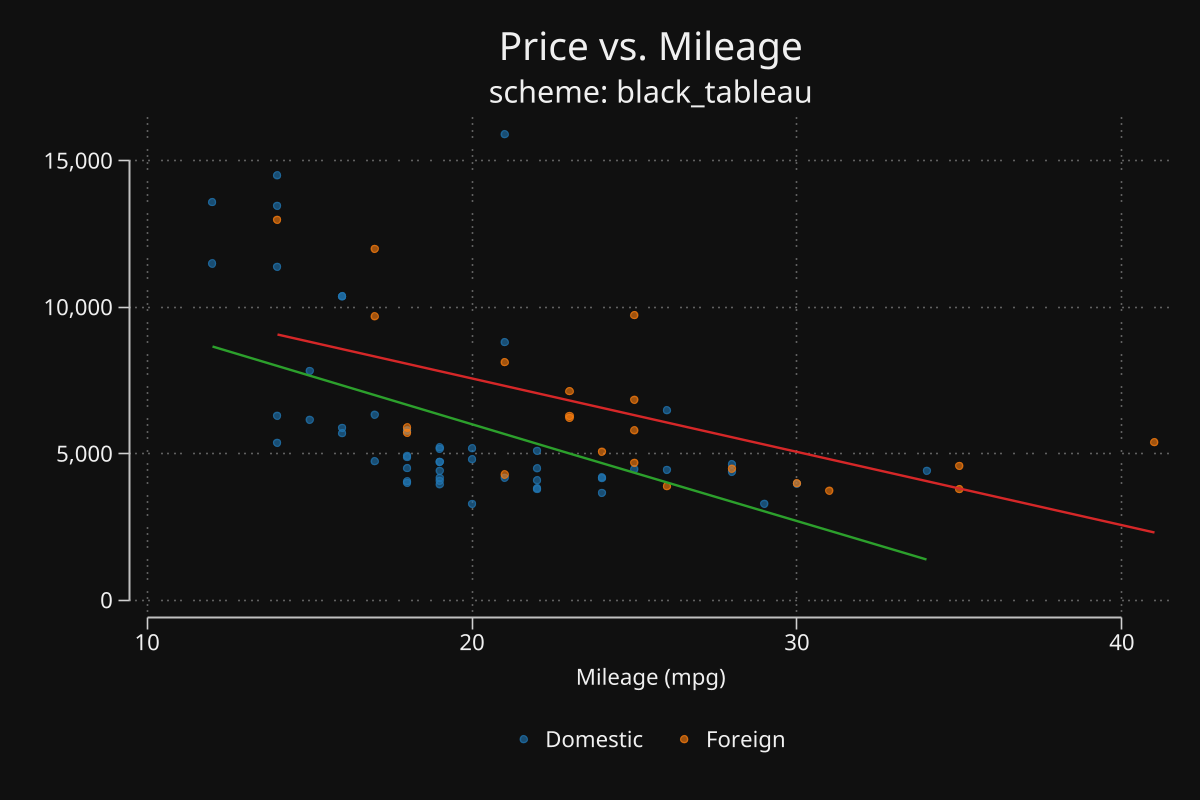 |
black_tableau |
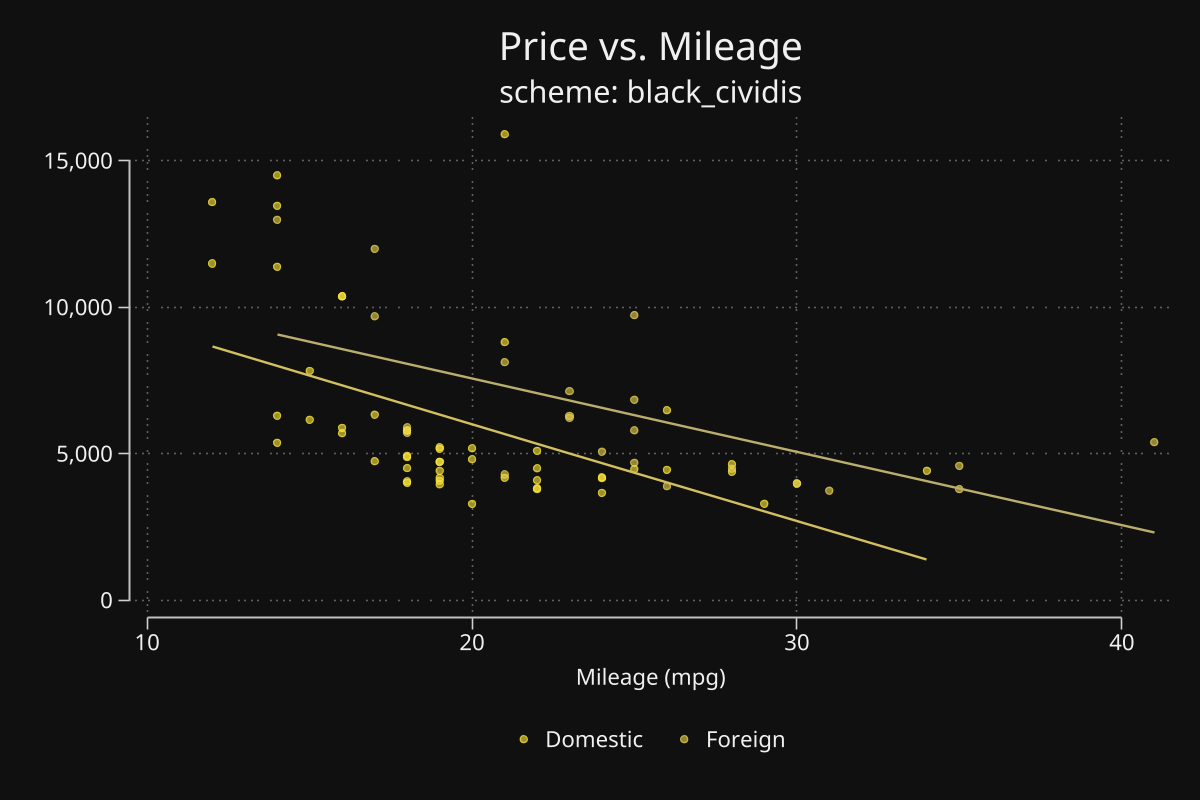 |
black_cividis |
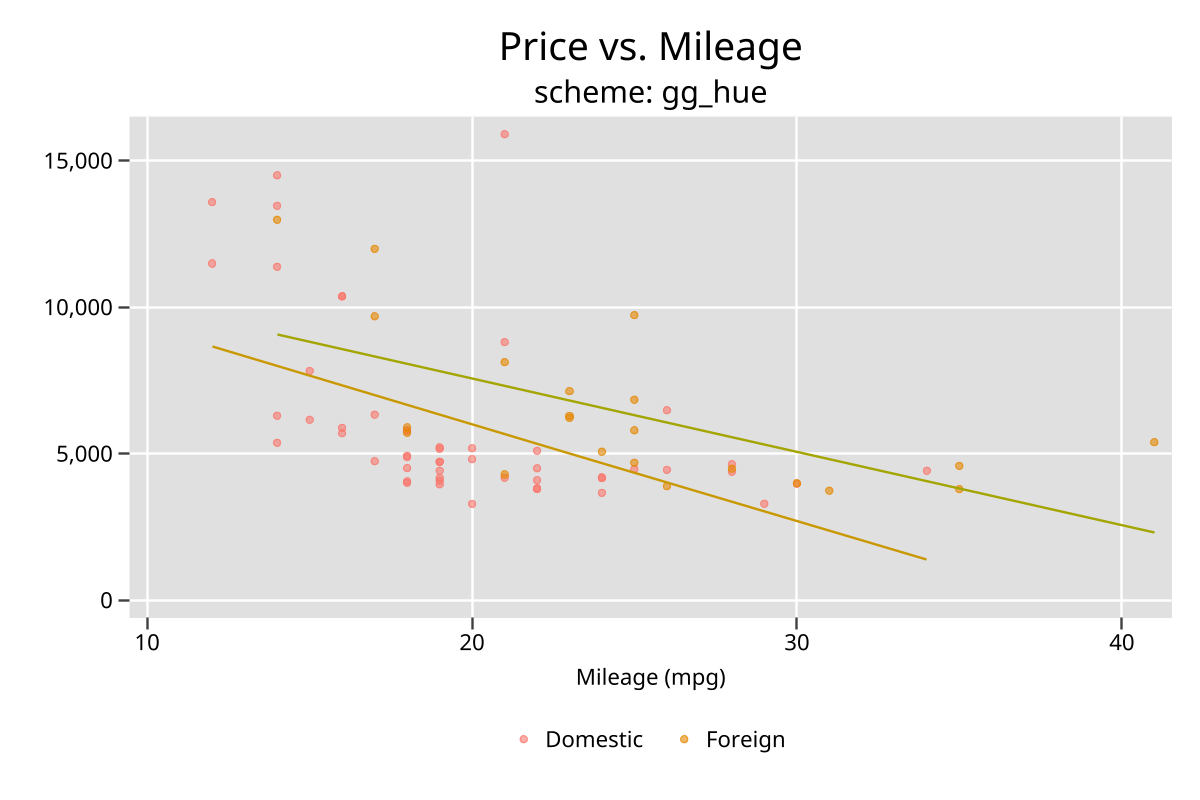 |
gg_hue |
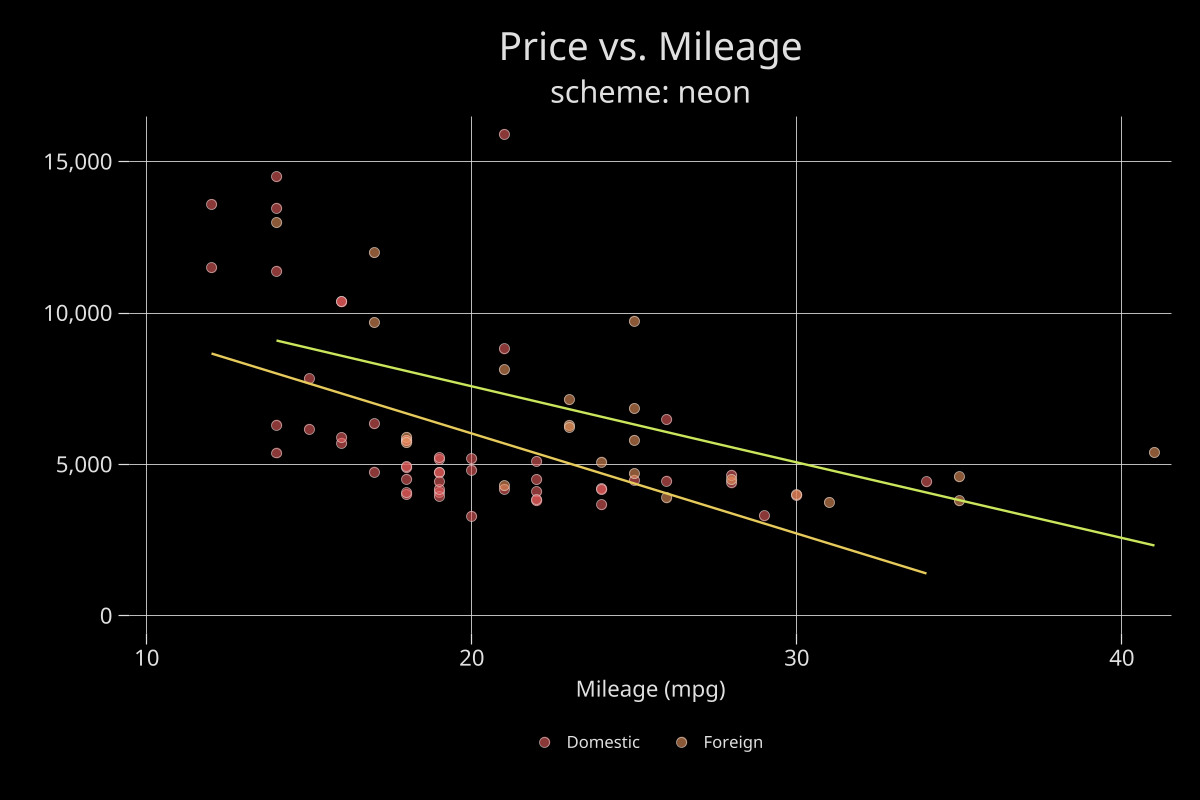 |
neon |
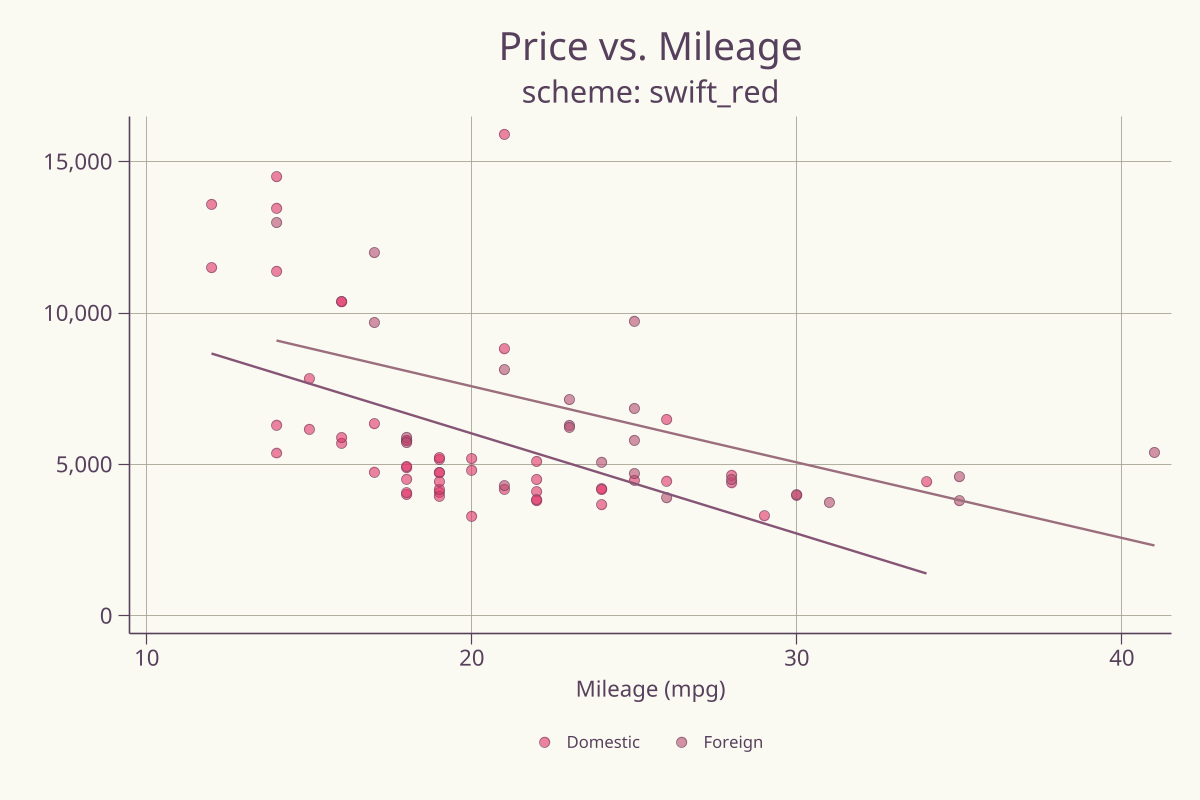 |
swift_red |
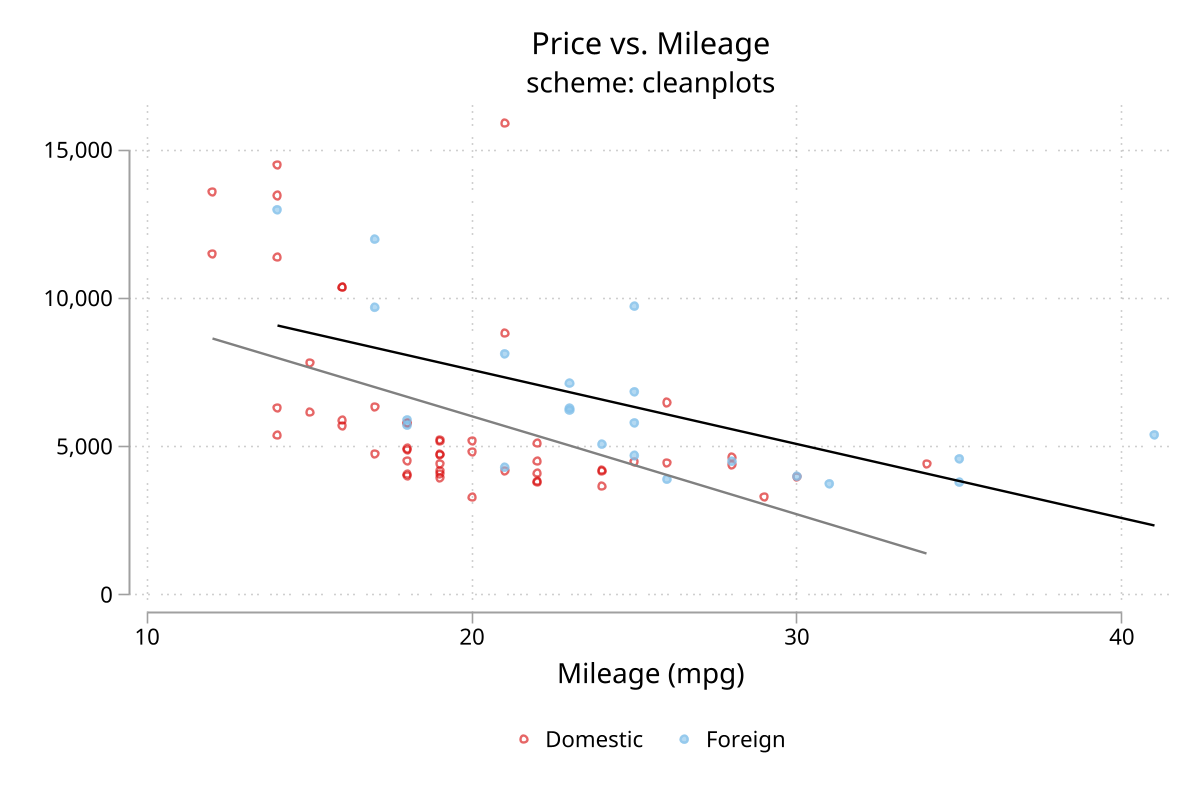 |
cleanplots |
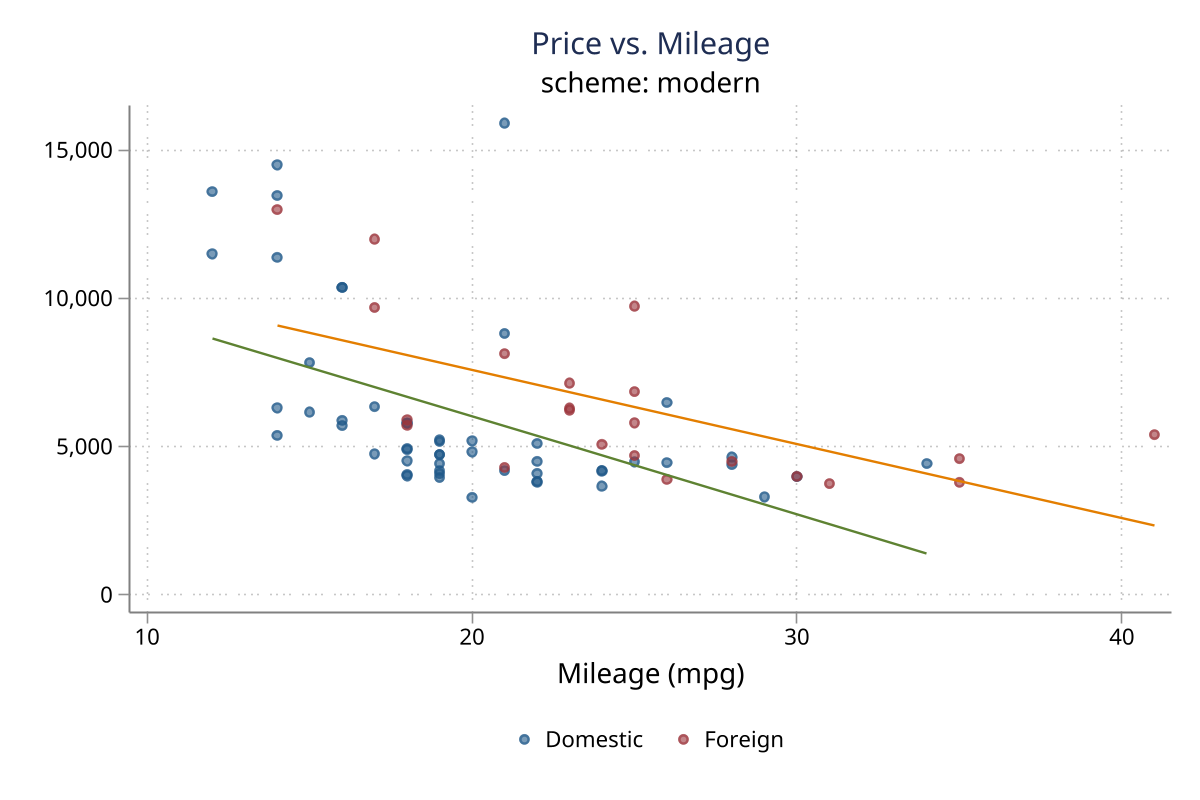 |
modern |
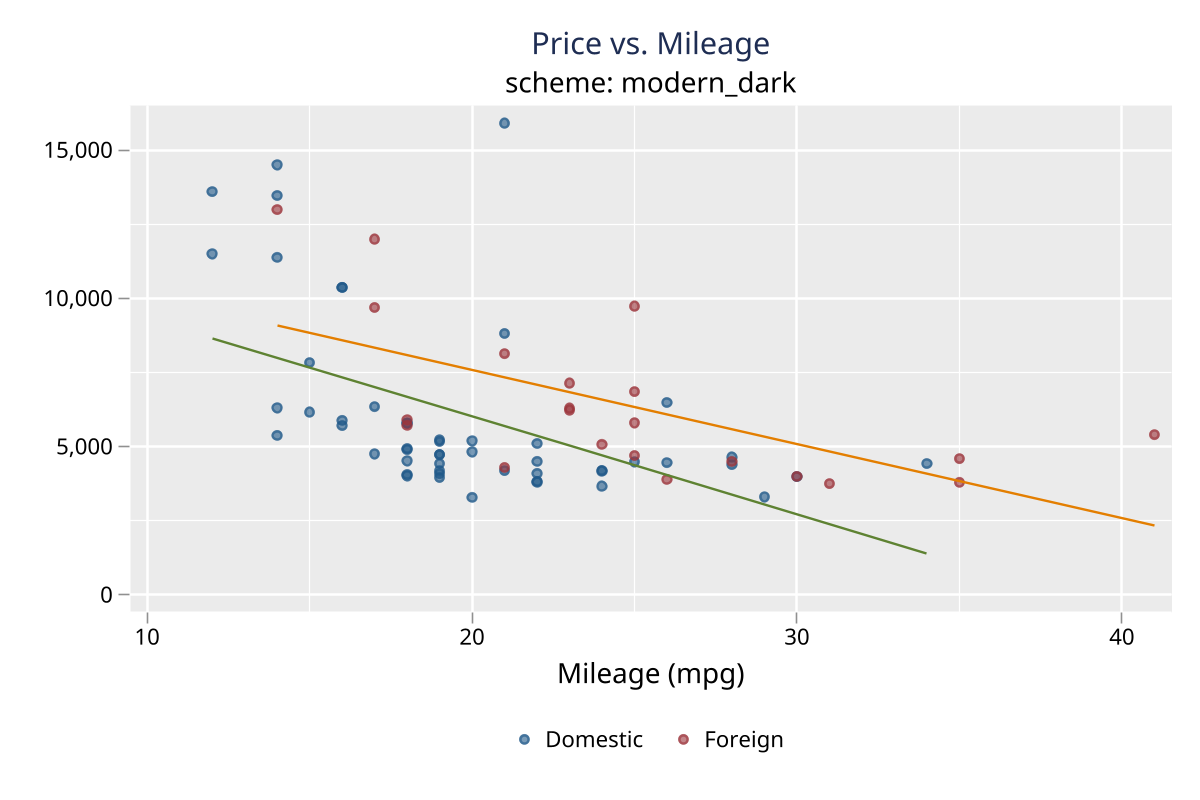 |
modern_dark |
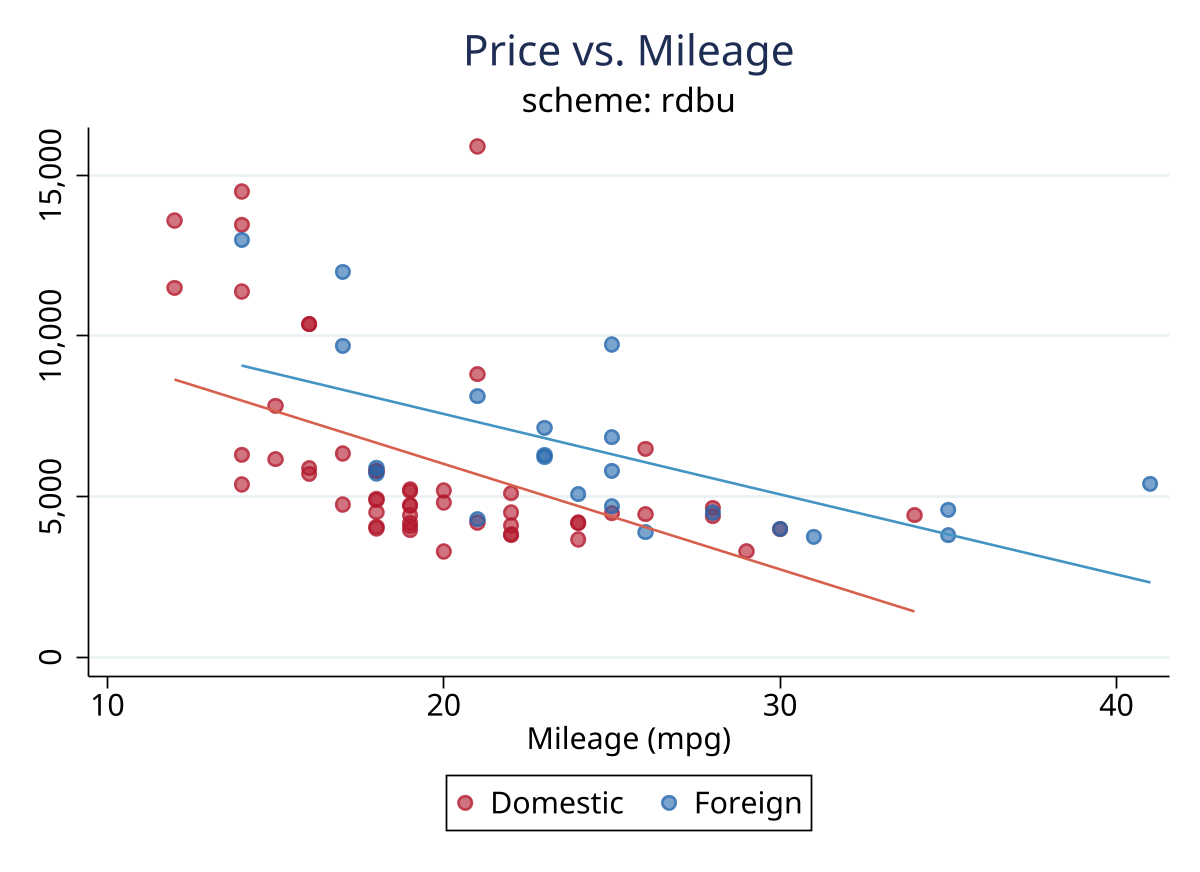 |
rdbu |
 |
ki |
 |
ki_black |
Command Reference
Syntax
tc_schemes [, source(string) list detail]
Display output
The default display groups schemes by source family, reports the selected total, and shows the set scheme and scheme() usage forms. list emits only the selected scheme names, while detail prints family descriptions, authorship, palette information, and usage notes.
Key Options
| Option | Minimum abbreviation | Default | Effect |
|---|---|---|---|
source(string) |
so |
all |
Select all, blindschemes, schemepack, cleanplots, modern, or tc |
list |
li |
off | Display selected scheme names as a simple list |
detail |
de |
off | Display detailed descriptions and attribution |
source() is case-insensitive. list and detail cannot be combined; an invalid source or a conflicting pair of display options returns Stata error 198.
Stored Results
After a successful call, tc_schemes stores the following results in r() regardless of whether the default, list, or detail display was requested:
| Result | Type | Meaning |
|---|---|---|
r(schemes) |
local macro | Space-separated scheme names in catalog order for the selected source |
r(n_schemes) |
scalar | Number of selected schemes |
r(sources) |
local macro | Selected source label(s); the default is blindschemes schemepack cleanplots modern tc |
r(version) |
local macro | Package version, currently 1.1.1 |
Assumptions and Limits
- The package supplies scheme and style files; it does not replace Stata graph commands or create graphs without a graph command.
- Use the exact scheme names shown by
tc_schemeswithset schemeorscheme(). - The
jetfamily is included for compatibility, but the help file recommends caution because rainbow-style scales can mislead for continuous data. cleanplots,modern, andmodern_darkare bundled unmodified with attribution. The wrapper code is MIT-licensed, while bundled upstream files retain their original licensing and attribution.
References
Bundled sources and attribution
- Daniel Bischof created
blindschemes; Mead Over supplied compatibility fixes included in this consolidation. Bischof, D. (2015), “Figure Schemes for Decent Stata Figures: plotplain & plottig.” - Asjad Naqvi created
schemepack, including the palette and background series collected here. - Trenton D. Mize created
cleanplots, which is bundled unmodified with attribution. - Michael Droste created
scheme-modern;modernandmodern_darkare bundled unmodified with attribution. rdbuuses colors based on ColorBrewer;kiandki_blackuse Karolinska Institutet brand colors, including KI plum (RGB 135 0 82).
QA
QA suites are available in qa/.
Version History
- 1.1.1 (2026-08-05): Corrected the help-file author metadata to use the canonical package attribution.
- 1.1.0 (2026-07-10): Added six schemes for 45 total, bundled
cleanplotsandmodern/modern_darkwith attribution, and added originalrdbu,ki, andki_blackschemes plussource()filters forcleanplots,modern, andtc. - 1.0.0 (2026-04-08): Initial Stata-Tools release consolidating
blindschemes,blindschemes_fix, andschemepackunder one installable catalog command.
Author
Timothy P Copeland, Karolinska Institutet
License
MIT for the wrapper command and original rdbu, ki, and ki_black schemes. Bundled upstream scheme files retain their original licenses and attribution.